
In this case study, we’ll discuss how ProsperOps transformed cloud financial management at a B2B SaaS with an already mature cost optimization capability.
Before we begin working with a new customer, we perform a free AWS Compute Savings Analysis to summarize their historical savings performance, overlay our algorithm on their data, and quantify the opportunity for optimization. That analysis is self-serve via our website and takes 5 minutes to configure and 45 minutes to review the results.
Dealing with suboptimal savings performance
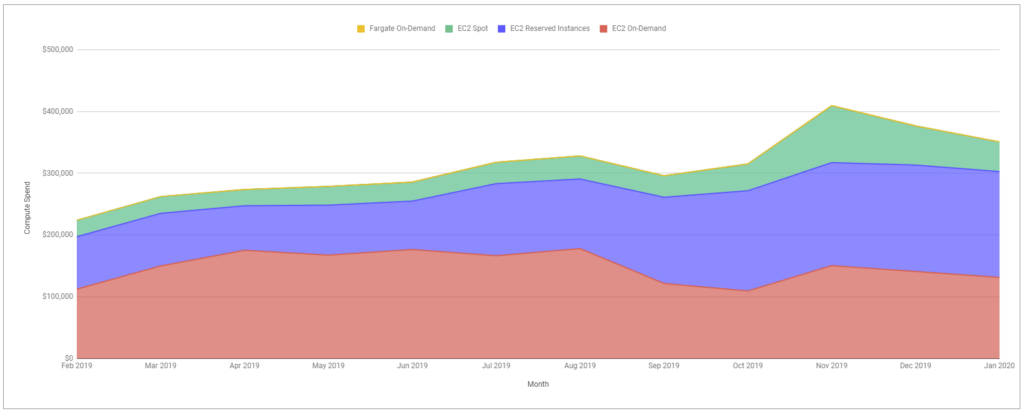
When we first engaged this prospect in February 2020, their compute usage had been steadily growing over the prior 12 months, culminating at $351,000/month in January 2020. Given that magnitude of spend, it was not surprising they had already made progress controlling the spend by using EC2 spot combined with a portfolio of 1 year Standard and Convertible Reserved instances (note: those RIs were a mix of Partial and All Upfront payment preferences that further increased the AWS discount… more on that later).
In Figure 1 you can see the breakdown of spend across multiple categories: discounted spot (Figure 1, green) and amortized RI commitments (Figure 1, purple) balanced against on-demand (Figure 1, red). This prospect also had a negligible amount of Fargate and were not using any Lambda or Savings Plans, otherwise that spend would be represented as well.
This company should have been generating significant savings on their AWS bill. When we actually calculated the ROI on their commitment instruments, we found they were leaving a lot of money on the table. On the positive side, in January ’20 they saved $47,000 (Figure 2, green bar), but lost $22,000 (Figure 2, red bar) from unutilized Standard and Convertible RIs. In fact, over the trailing twelve month period, the savings loss from unutilized commitments totaled $111,000 (Figure 2, red bars).
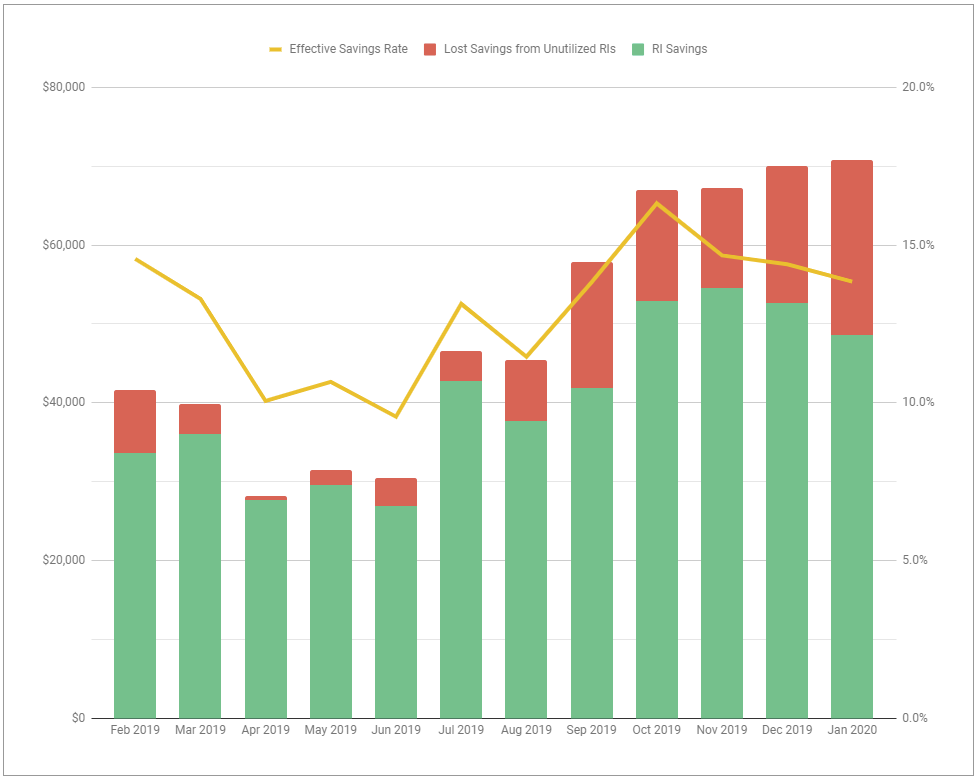
Understanding the absolute savings dollars are important, but we also helped them understand their Effective Savings Rate (ESR), which gives them a relative performance metric to evaluate over time. You can think of the Effective Savings Rate as the ultimate truth-teller metric when it comes to cloud financial management. The ESR is the overall discount received on global compute spend once you take into account utilization, coverage, discounts, etc. If you’re doing a good or bad job, the ESR will let you know. This prospect’s trailing 12 month ESR averaged 13.1% (Figure 2, yellow line).
We track the ESR of every prospect and have collected ~1400 data points, which gives us a representative picture of the state of financial optimization across the AWS user base. At 13.1%, this prospect was in the 64th percentile of AWS optimizers. Not bad. The average AWS user achieves an ESR of ~10%. However, ProsperOps can safely drive Effective Savings Rates into the 98th percentile, which means an aggregate discount greater than 40%. That type of change will create tens of thousands of dollars of incremental monthly savings.
A superior approach to cloud financial optimization
One of the primary variables that drives ESR is the magnitude of coverage established when commitments are made. In many ways, commitment capacity planning ends up being the most complicated aspect of cloud financial management because the usage backdrop is constantly changing. Prospects usually are faced with the choice of being too conservative or too aggressive with regards to coverage, because once commitments are made they are generally fixed in terms of the duration and the hourly financial commitment.
ProsperOps showed the prospect an easier way to incrementally save with more flexibility and less commitment risk. By analyzing their historical commitment levels through the financial lens, we could understand the relationship between their total financial commitment (Figure 3, red line), the utilized financial commitment that actually generated a discount (Figure 3, gray line), and their total usage (Figure 3, purple bars) over time. That relationship helps us understand how they’ve historically thought about risk…either explicitly or implicitly. For example, the dollar value of this prospect’s commitment was about 70% of their overall usage. This means they’ve effectively maintained a 30% on-demand buffer to account for any business changes or rearchitecture work that could cause usage to drop. However, that buffer comes at a cost…30% of their total usage still remains at the on-demand rate, which pulls down the Effective Savings Rate.
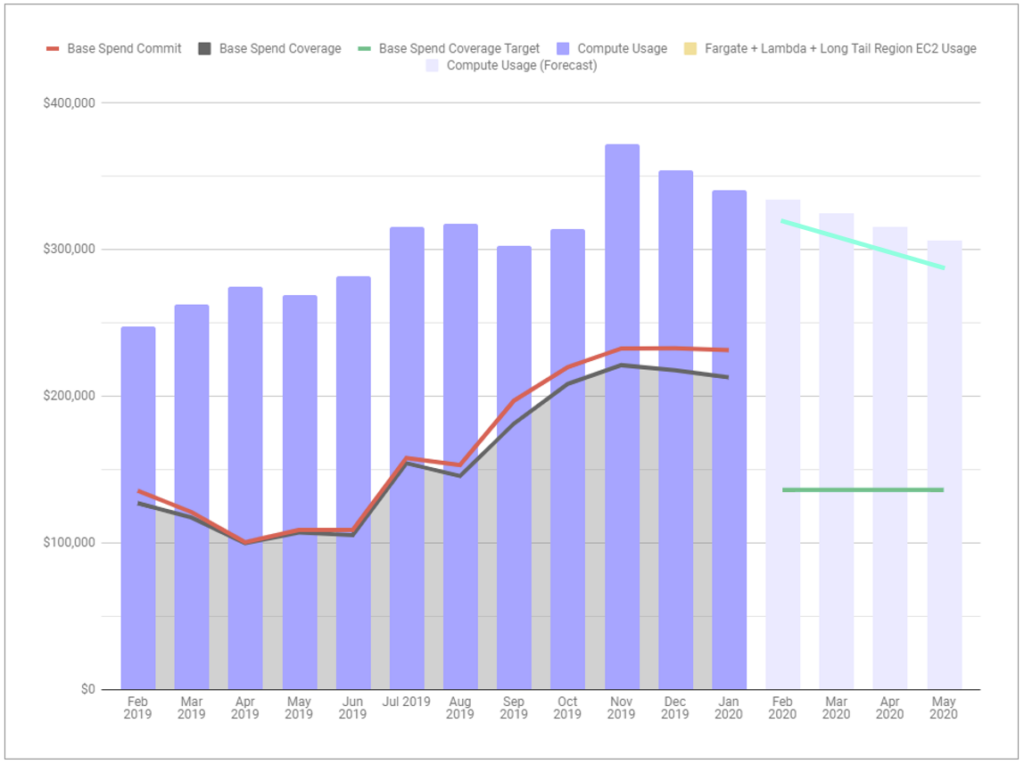
Our opinionated strategy mitigates future commitment risk by ultimately converging the commitment to two layers: a conservative and largely static “Base” commitment (Figure 3, green line) made up of Compute Savings Plans (plus any existing savings instruments) and a dynamic “Flex” layer (Figure 3, light green line) of term-optimized Convertible Reserved Instances that cover the remaining usage. We value Compute Savings Plans in the conservative Base commitment because they cover EC2, Fargate, and Lambda, as well as float across regions. However, they are fundamentally immutable commitments, meaning you are locked in to a fixed $/hr commitment for the full term, period (i.e., if your usage were to drop below the Savings Plan commitment amount, you are in an over-committed state and over-paying). A Flex layer of Convertible RIs complements the base because the value of that commitment can be dynamically adjusted to track usage changes in real-time. This strategy, enabled by algorithms and automation, allows ProsperOps to ultimately cover 95+% of total usage—safely—while maintaining a 99.9%+ utilization across the commitments. Best of all, this work is completely handled by ProsperOps, so the customer can spend time on other facets of optimization and know their commitment portfolio is constantly synchronized and generating the maximum Effective Savings Rate.
Maximizing savings while minimizing risk
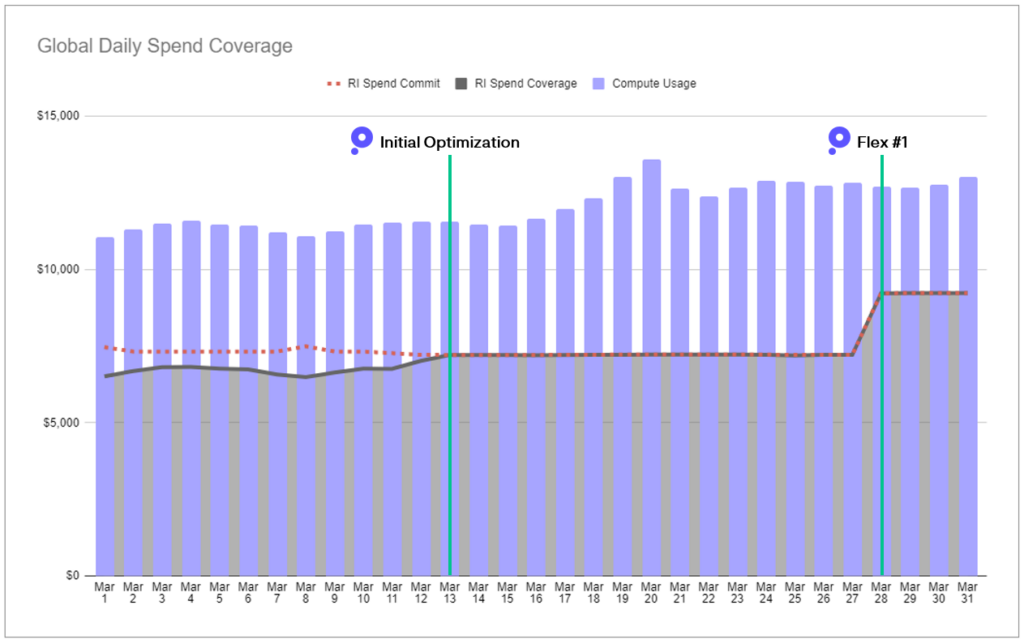
Once this prospect became a customer on March 13th, they experienced savings immediately. Their existing RI utilization immediately increased to 100% with our service. You can see the gray shading, which represents the portion of their commitment that was utilized, converge to the redline, which represents their total commitment (Figure 4, Initial Optimization). In addition, this customer had dollars left over in their Q1 budget and allowed our service to Flex their All and Partial RIs to generate more savings. The first Flex was executed on March 28th and you can see the red/gray commitments increase as a percent of their daily usage (Figure 4, Flex #1).
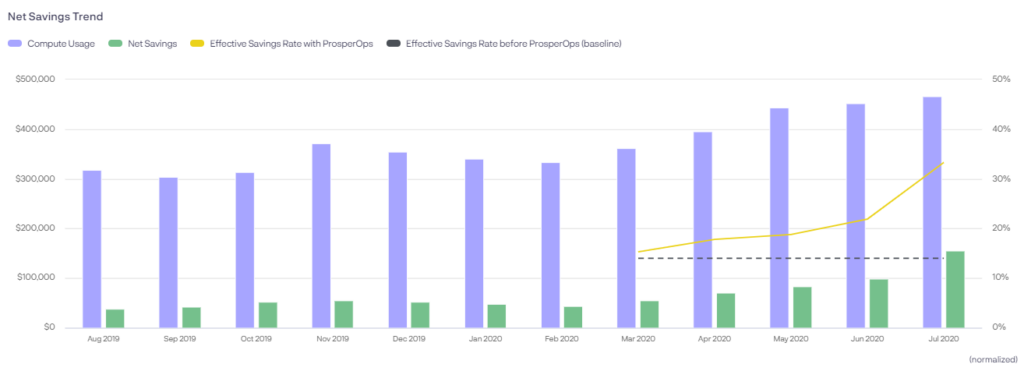
The month-over-month improvement in savings (Figure 5, green bars) and Effective Savings Rate (Figure 5, yellow line) continued and grew faster than their compute usage (Figure 5, purple bars). By August 2020, 5 months following subscription, this customer’s monthly savings had increased by 252%. Their ESR increased from 14.0% in the month prior to subscription to 33.3%. That ESR places them in the 91st percentile of AWS savers and it will continue to climb towards 40+%. Monthly net savings (i.e., after ProsperOps’ charge) increased from $44,000 in the month prior to subscribing to $155,000 per month. In addition, all flex commitments are term-optimized and expire within the next 3 months.
More savings. Less commitment risk. No manual work. No rearchitecture. A larger cloud budget. One less thing to worry about. If you’d like to understand how ProsperOps could generate similar results for your business, signup to receive a complimentary AWS Compute Savings Analysis.