The promise of elastic cloud infrastructure is the ability to quickly spin compute up and down and only pay for what you use. Workloads have different requirements and, depending on customer maturity level, take advantage of this capability to varying degrees. This ultimately leads to a wide variety of workload patterns from consistently stable to highly volatile.
Commitment-based discounts (e.g. Reserved Instances, Savings Plans, Committed Use Discounts, etc.) are arguably the biggest lever cloud providers make available to reduce cost. However, optimizing for savings as workload patterns become increasingly volatile is challenging. In this post, we’ll explore the best way to do that.
Hint: We’re going to use Effective Savings Rate (ESR), the ultimate rate optimization metric. If you aren’t familiar with ESR yet, please take a moment to review at least this introductory ESR blog post before reading further.
Stable Cloud Usage Patterns
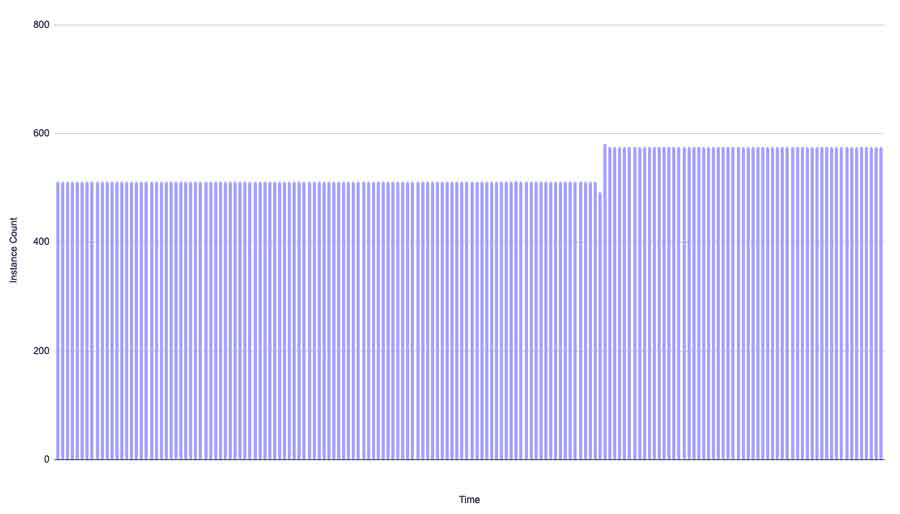
As cloud adoption begins, and for certain persistent workloads, it’s common for usage patterns to be stable. You spin up the necessary instances and let them be. You may periodically add or remove capacity in a stepwise fashion, but your workload profile is stable, and looks something like this:
Maximizing savings in a stable workload scenario is fairly straightforward—you cover stable usage and step up coverage as usage steps up. If we assume a high coverage rate and a small delay before new commitments are deployed, coverage might look something like this:
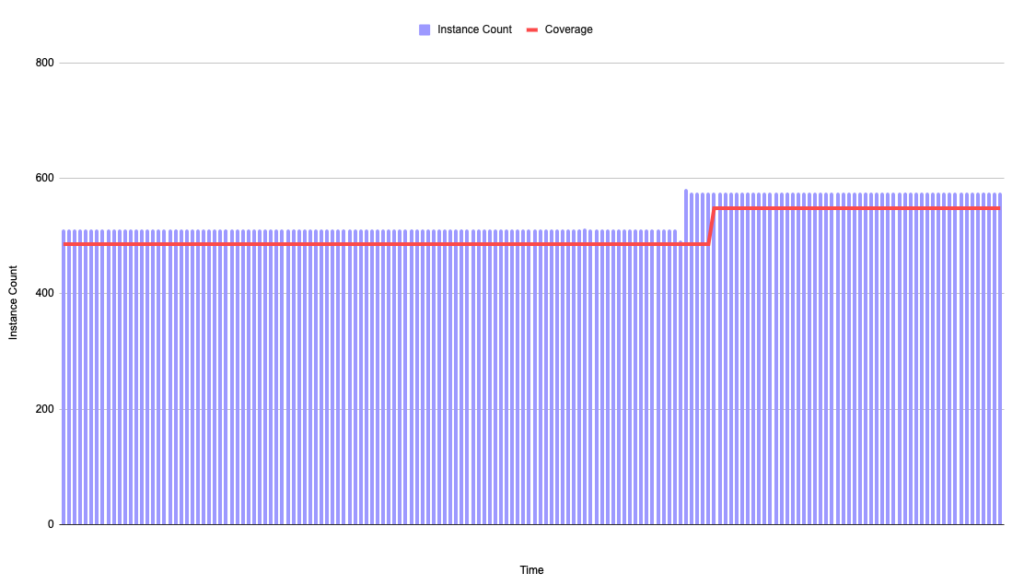
In this example, our commitment-based discount delivers a 30% discount off the on-demand rate, resulting in the following metrics for this period of time:
| Coverage: | 94.7% |
| Utilization: | 100.0% |
| Discount Rate: | 30.0% |
| Effective Savings Rate: | 28.4% |
Cyclical Cloud Usage Patterns
Now, let’s complicate things a bit. As customers mature on their cloud journey, it’s normal to implement auto scaling groups, scheduled instances, containers, etc.—all of which increase usage volatility.
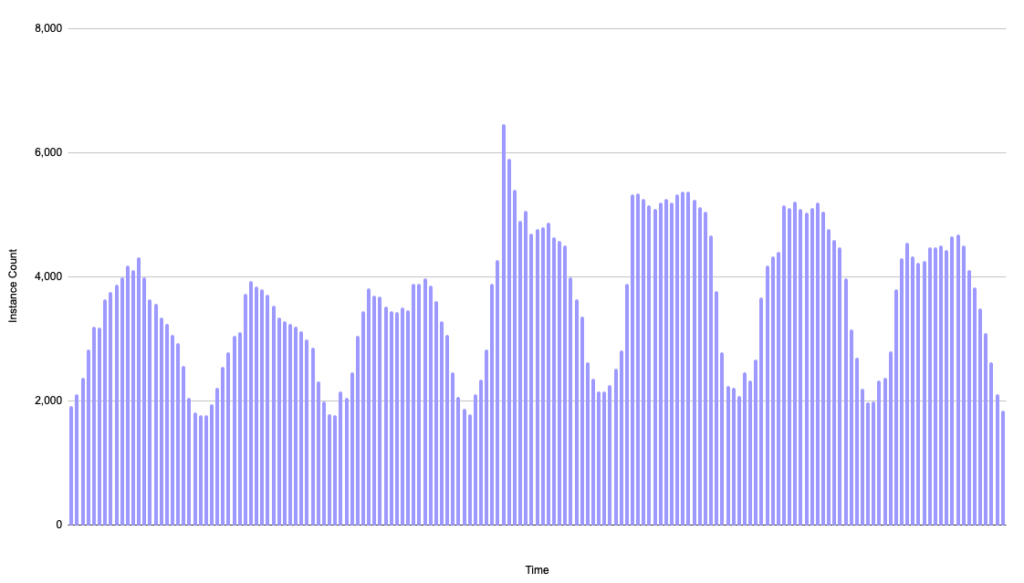
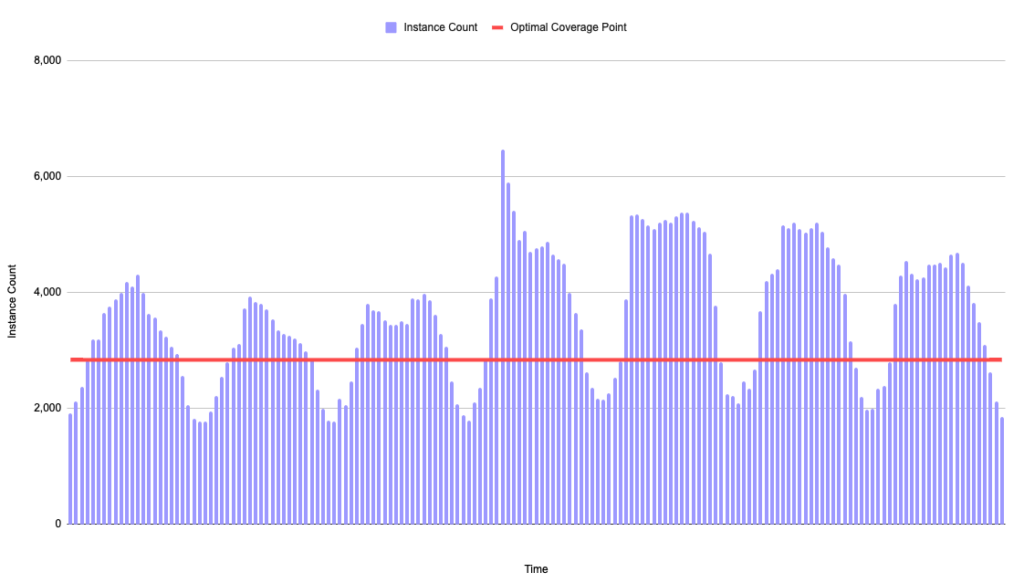
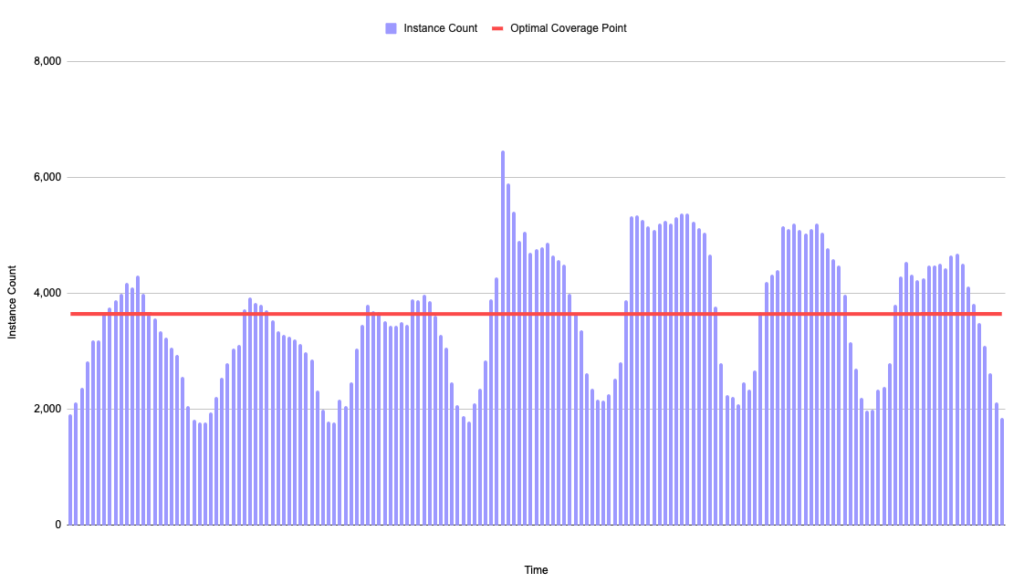
This often leads to cyclical workload patterns that look something like this actual seven-day usage pattern from one of our customers. We frequently see this type of pattern:
If your goal is to optimally cover this usage with commitment-based discounts to achieve the highest possible ESR, how would you do that?
A common but suboptimal method is to cover at the trough of the cycles. An underlying assumption of that approach is that un-utilization is bad (we’ll discuss why that’s not the case later). If we assume a 30% discount rate and cover at the trough of 1,768 instances, we get the following results:
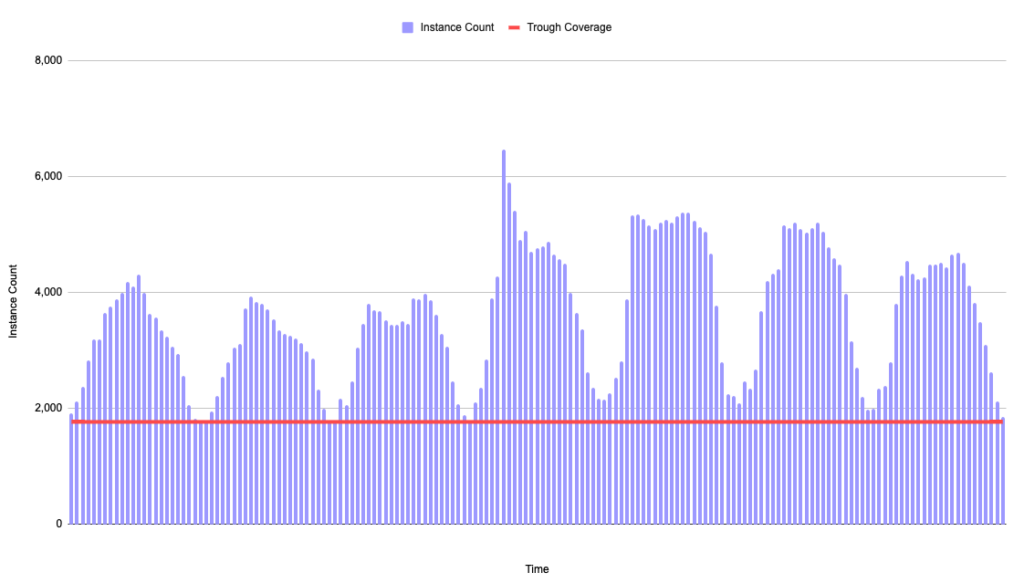
| Coverage: | 49.2% |
| Utilization: | 100.0% |
| Discount Rate: | 30.0% |
| Effective Savings Rate: | 14.7% |
The results of covering at the trough of cyclical workloads keeps utilization high, but causes more usage to be paid for at on-demand rates, which lowers the ESR.
Can we generate more savings on cyclical workloads?
The answer is yes! To do that, we need to cover above the trough and into the cycle further, which will increase coverage but reduce utilization. The question is, how far into the cycle should we cover?
If you are only measuring and optimizing for coverage and utilization, that’s a difficult question to answer. In part 2 of our ESR blog series, we share examples of how optimizing for coverage and utilization alone can lead you astray and produce inferior savings outcomes. The solution in that post is the same as the solution here: optimize for ESR instead, which will always guide you to the maximum savings outcome.
As we increase coverage, there will be an offsetting that takes place. Each additional unit of coverage will discount usage when it’s utilized but be a headwind to savings when it’s unutilized. Depending on the specific cyclical shape, at some point the incremental cost of unutilized commitment will outpace the incremental savings benefit of covered usage. After that point, adding incremental coverage will start to decrease savings. We need to find the exact point where total savings, and thus ESR, are maximized.
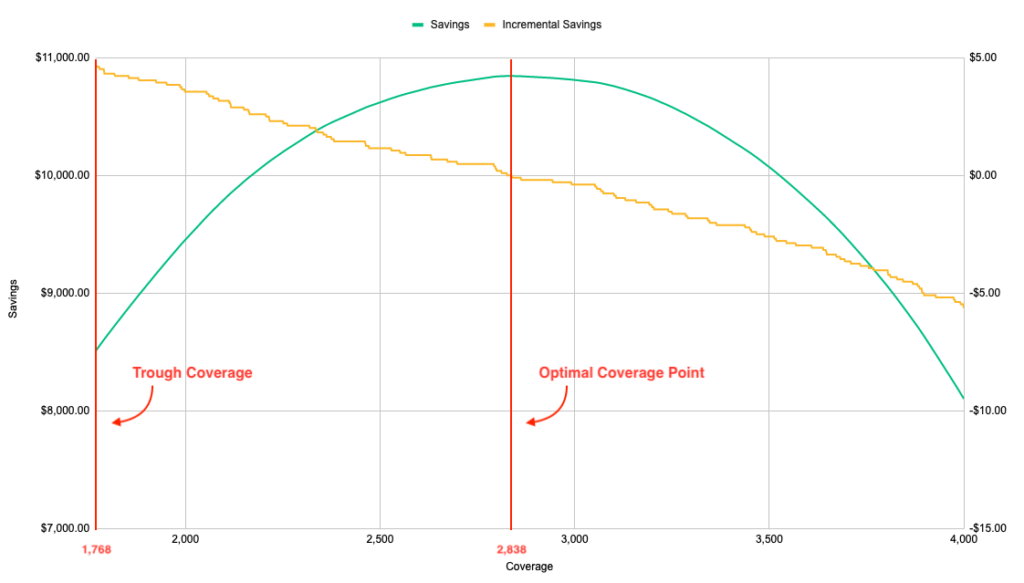
To determine this, we can plot savings vs. coverage. On the x-axis, we show various coverage amounts starting at the trough value of 1,768 and increasing as you move right. On the left y-axis, we show the total savings generated (in this case, over a seven-day period). On the right y-axis, we show the incremental savings change over the period of adding additional units of coverage.
From there, we can locate the point at which 1) total savings (and ESR) are maximized, and 2) adding an additional unit of coverage produces negative incremental savings. Those two things always happen at the same optimal coverage point. In our example, you can see both of these occur at 2,838.
Note: Savings (green) is on the left y-axis while Incremental Savings (yellow) is on the right y-axis.
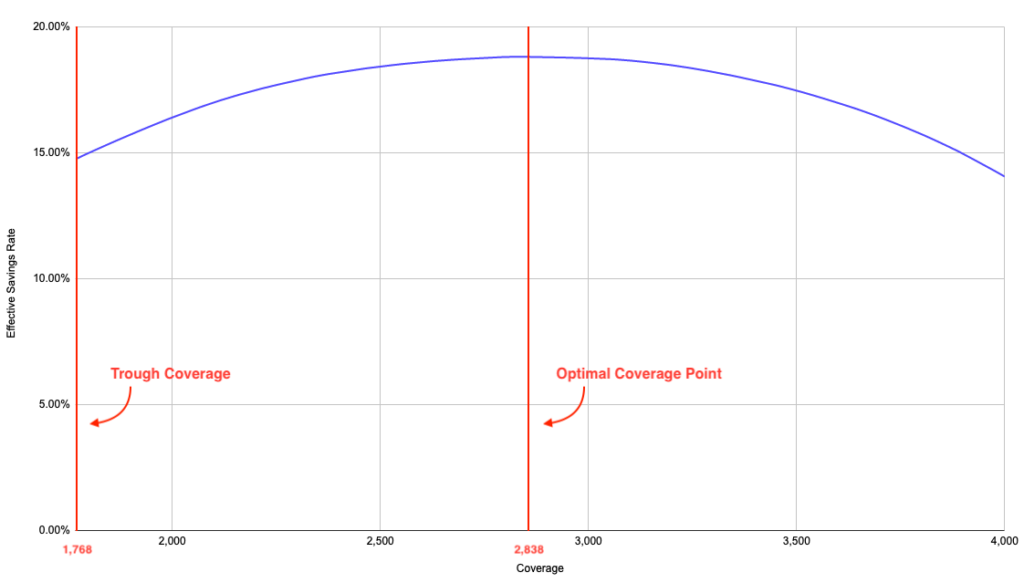
Maximizing ESR always results in maximum savings, so if we plot the same chart using ESR, we see the optimal coverage point is also where maximum ESR occurs.
Applying the optimal coverage point to our cyclical workload pattern looks like this:
The optimal coverage point of 2,838 instances is 161% more coverage than the trough of 1,768 instances. As a result of covering above the trough, utilization has dropped to 93.8% but ESR is 28% greater!
| Coverage: | 74.0% |
| Utilization: | 93.8% |
| Discount Rate: | 30.0% |
| Effective Savings Rate: | 18.8% |
To put the above example into perspective for this real-world example: your outcome would equate to an incremental savings of $10k per month or $120k in savings during a full year! Un-utilization isn’t always bad, and in this case, it is necessary to maximize savings.
Impact of Discount Rate
Another important factor to understand is that the optimal coverage point changes with discount rate. This happens because the rate at which incremental savings is offset by incremental unutilized headwind is directly tied to how much savings each incremental unit of coverage delivers.
In other words, the higher the discount rate, the higher into the cycle the optimal coverage point will be. If we raise the discount rate from 30% to 50% and rerun the analysis, we get a higher optimal coverage point of 3,645.
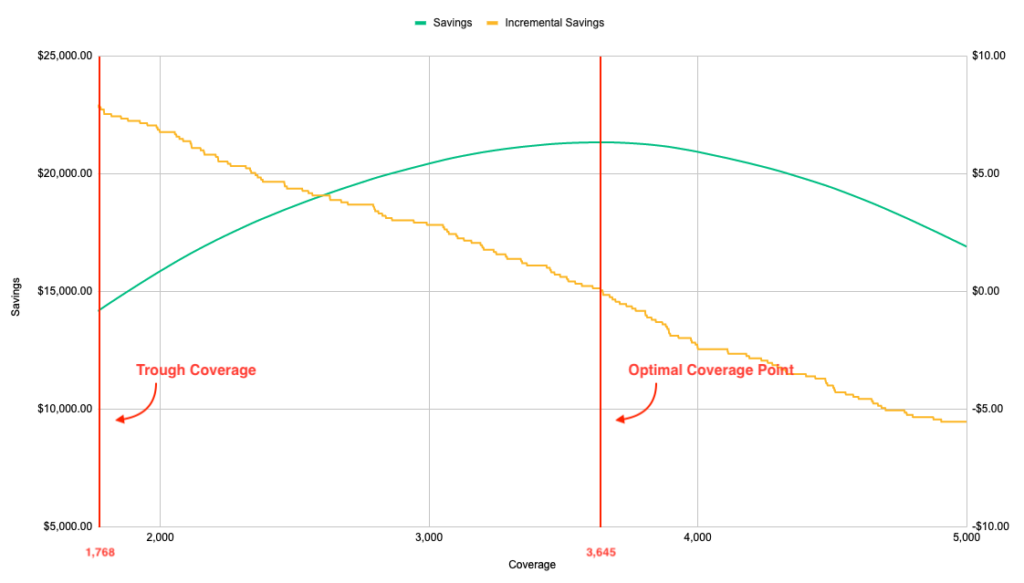
Applying the optimal coverage point to our cyclical workload pattern now looks like this:
With the higher discount rate, our optimal cyclical coverage point of 3,645 instances is now 206% more coverage than the trough of 1,768 instances. Utilization has dropped further to 87.7% but ESR is now 51% greater!
| Coverage: | 87.7% |
| Utilization: | 86.5% |
| Discount Rate: | 50.0% |
| Effective Savings Rate: | 37.0% |
To put that into perspective for this real-world example: that equates to an incremental savings of $31k per month or $374k in savings for a full year! Do we have your attention now? 🙂
Summary Points
- Covering into cyclical workload patterns with commitment-based discounts isn\’t a minor optimization; it can have a material positive impact on your ESR and cloud savings. It’s absolutely worth considering how you might be more aggressive here.
- Cyclical workload patterns are becoming more commonplace as customers mature and embrace more dynamism, so the opportunity and need to optimize cyclical workloads is only going to increase with time.
- Covering at the trough of cycles optimizes for utilization but leaves savings on the table. Instead, cover into the cycle where savings and ESR are maximized.
- The higher the commitment-based discount rate, the higher into the cycle you can cover, and thus the higher your incremental savings and ESR will be.
- Un-utilization isn’t the enemy. In fact, you will purposefully need to lower your utilization in order to maximize savings. If you are currently optimizing for utilization, optimize for ESR instead.
We hope this is helpful for anyone looking to save as much money as possible on their cloud bill. At ProsperOps, our mission is to simplify and fully automate maximum savings outcomes for our customers.
Request a demo to learn more about ProsperOps.
Prosper On! 🖖
Erik