

TL;DR
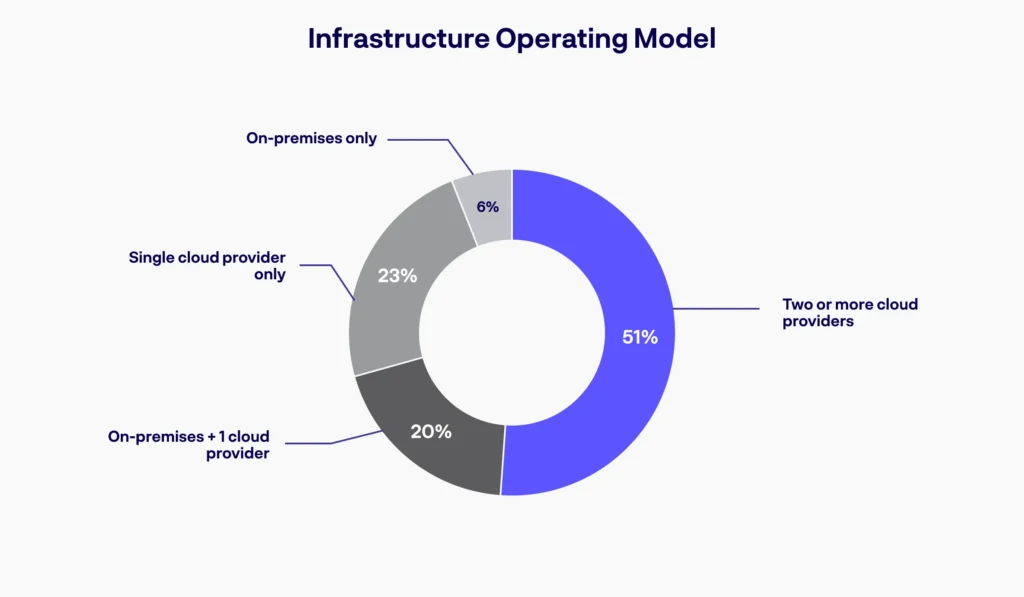
- Most engineering environments are cloud-native and complex; 51% of platform engineers support multi-cloud environments.
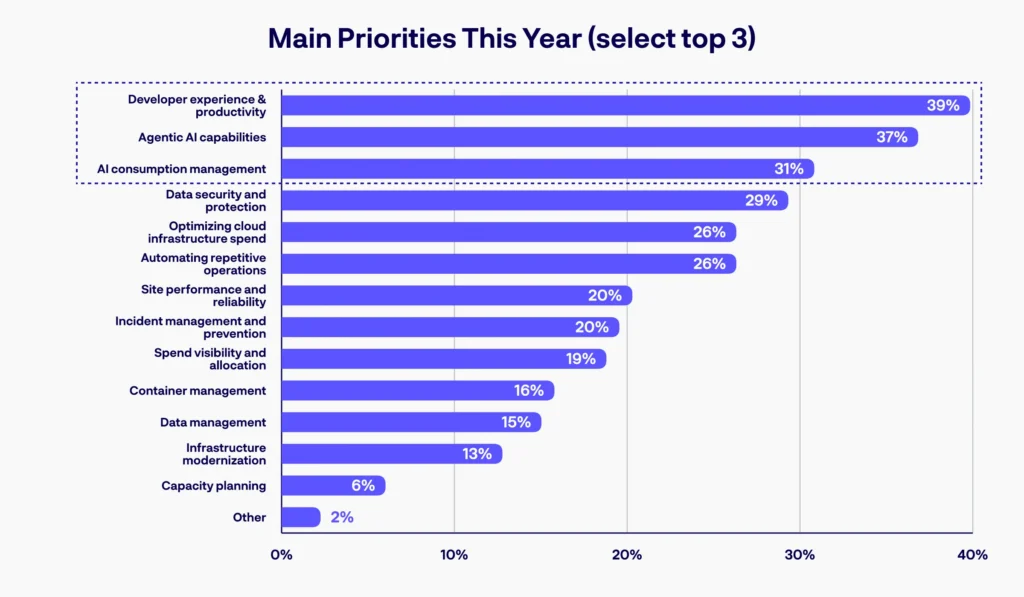
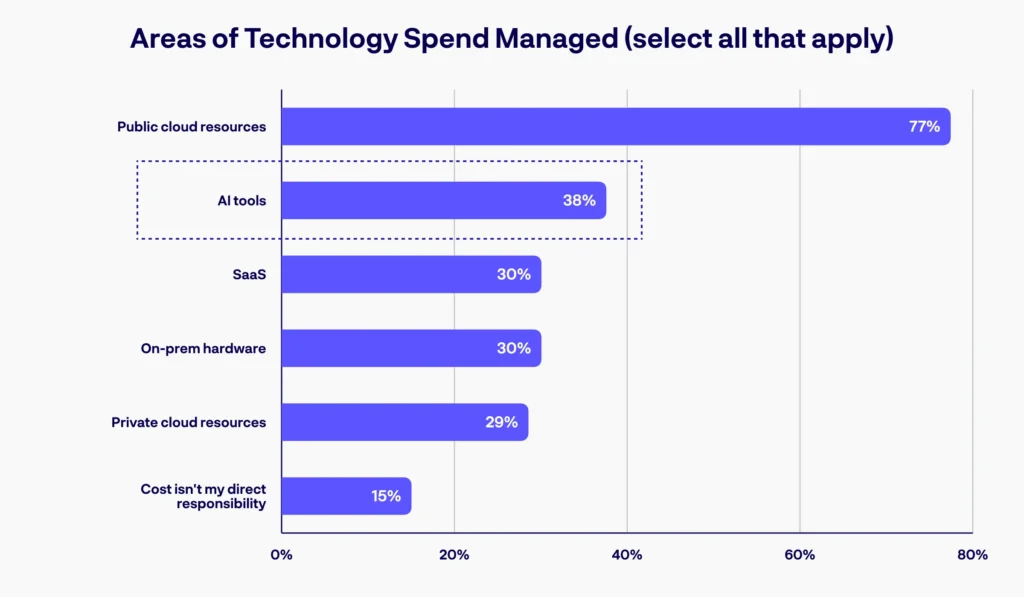
- While “Developer experience & productivity” stayed the top priority, managing cost grew in importance, especially around AI. Platform engineers have also expanded the scope of their technology spend management to include AI tools.
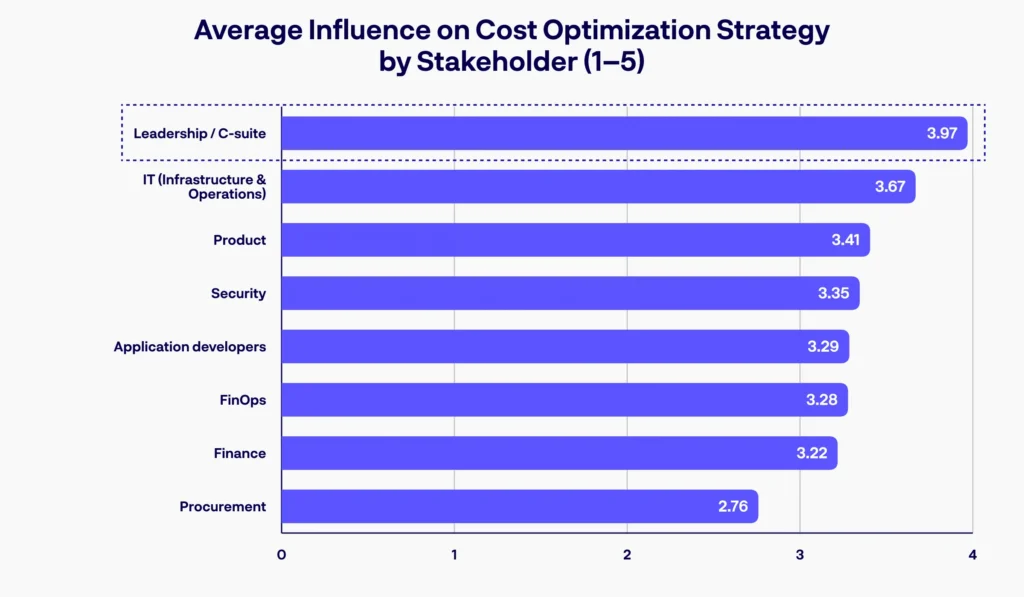
- The mandate for cost optimization strategy came from the top: “Leadership/C-suite” carried the most influence over cost strategy, followed by “IT (Infrastructure & Operations)” and “Product.”
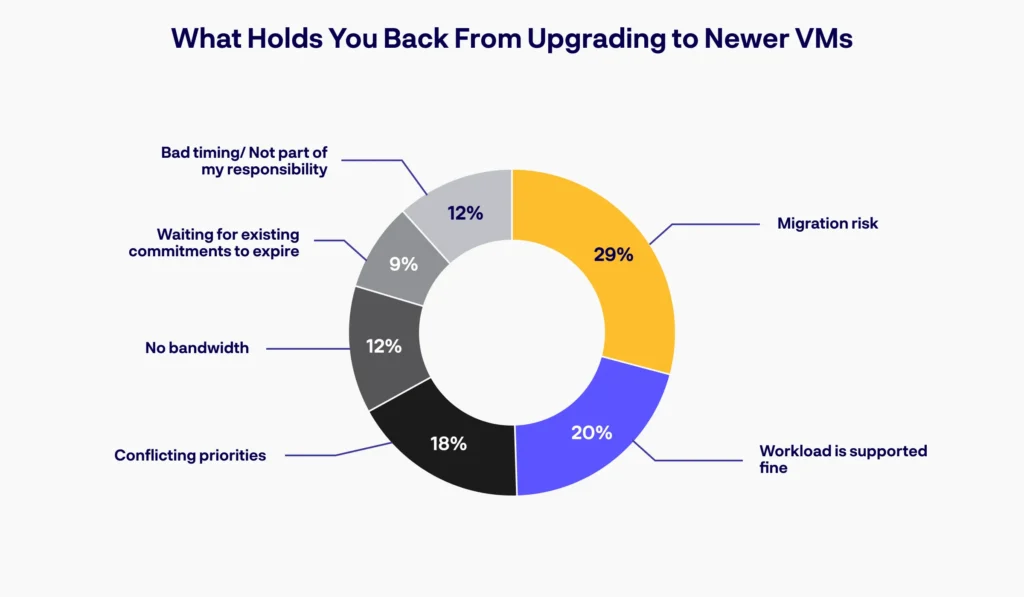
- VM modernization was deprioritized. Only 34% say always staying on the most current infrastructure is “Very important.” “Migration risk” was the top reason for not modernizing.
- The biggest gap: 29% of platform engineers didn’t measure the impact of their internal developer platforms (IDPs), likely because platform engineering as a discipline is still maturing for many organizations. Among those who measured impact, “Developer velocity” was most commonly used, but alone, it may not tell the whole story.
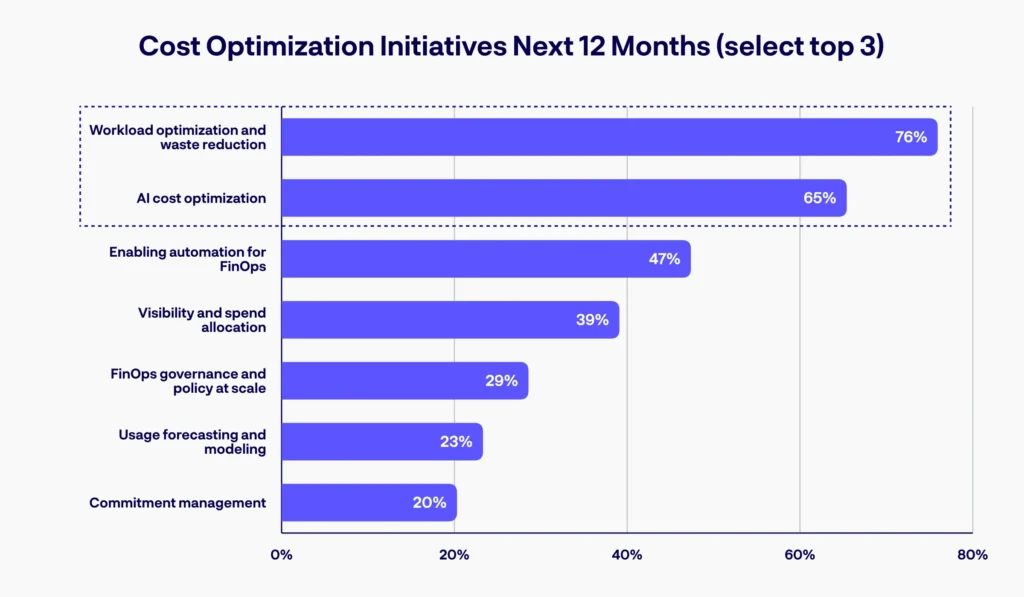
- The top two focus areas for the next twelve months will be “Workload optimization and waste reduction” and “AI cost optimization”. Controlling costs effectively will require automated, purpose-built solutions.
Methodology
- Participants: 100+ unique responses globally
- Timing: Data collected April–June 2026
- Scope: 9 questions covering participants’ responsibilities, priorities, metrics, and tooling, focused on cost optimization.
- Data: Fully anonymized and presented in aggregate
Platform Engineers Support Complex, Hybrid Environments
Platform engineering teams are often part of cloud-mature organizations. 51% supported multi-cloud environments.
Developer Experience Still Leads, but Cost Is Catching Up
While “Developer experience & productivity” was the top priority, “Agentic AI capabilities” and “AI consumption management” followed closely. This was in sharp contrast to last year, when CI/CD and Infrastructure-as-Code (IaC) led and AI/LLMs were less important (source: 2025 State of Platform Engineering Report, vol. 4).
Technology Spend Management Broadened to AI Tools
With AI-based developer tools on the rise, platform teams are likely under greater pressure to govern AI costs effectively. The vast majority managed spend for public cloud resources, but 38% also owned AI tools.
Executive-Led Cost Optimization Mandates
“Leadership/C-suite” carried more influence over cost optimization strategy than any other stakeholder group (average: 4.0 of 5), followed by “IT (Infrastructure & Operations)” and “Product,” on a 1–5 scale (1 means little/no influence while 5 means key stakeholder). Key platform decisions came from the top.
VM Modernization Deprioritized Due to Migration Risk
Cloud providers often introduce new VMs and retire old ones. Staying cost-performant in the long run requires modernizing to newer VMs. 34% of platform engineers agree that “It is very important to be on the most current infrastructure.”
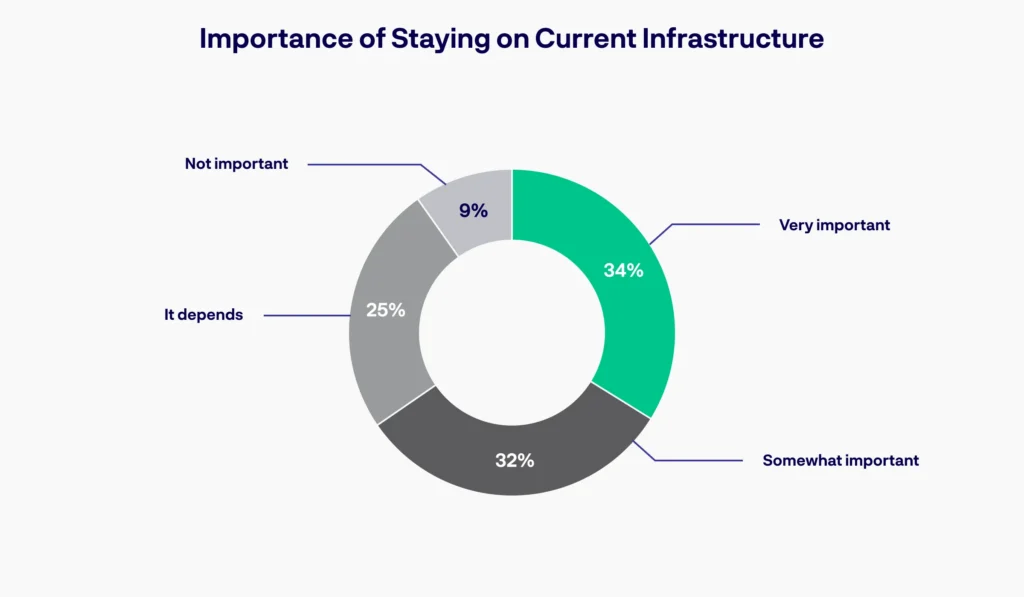
Yet, “Infrastructure modernization” was a low priority. “Migration risk” was the leading reason platform engineers held back from VM modernization (29%), followed by “Workload is supported fine” (20%), among those who did not think VM modernization was very important.
Biggest Gap: Platform Engineers Aren’t Measuring IDP Impact
Despite the growing importance of managing platform costs, most platform teams couldn’t confidently say whether they were succeeding.
29% didn’t measure the impact of their internal developer platforms. It is likely that platform engineering as a discipline is still in its early stages for most organizations. Measurement processes remain informal and ad-hoc, and dedicated ownership over measuring outcomes may not reside solely within platform engineering teams.
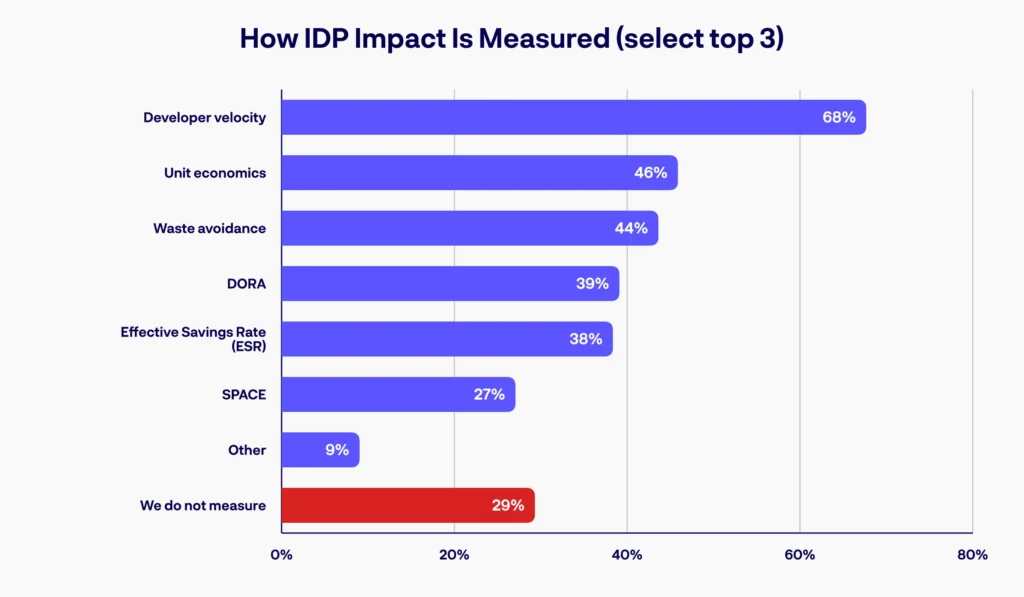
Among respondents who measured impact, “Developer velocity” was the most popular metric, likely because it’s easy to quantify and aggregate at scale (e.g., via surveys). On its own, though, it can be a vanity metric that says little about developer productivity, which is much harder to measure.
“Unit economics” and “Waste avoidance” were also commonly used metrics, though less popular, since gathering and calculating the data may be more challenging.
Those Measuring Often Use Methods That Don’t Scale
Most lacked purpose-built solutions to track impact metrics. 51% used free “Cloud native tools,” followed closely by “Open-source tools” (44%) and “Spreadsheets” (43%).
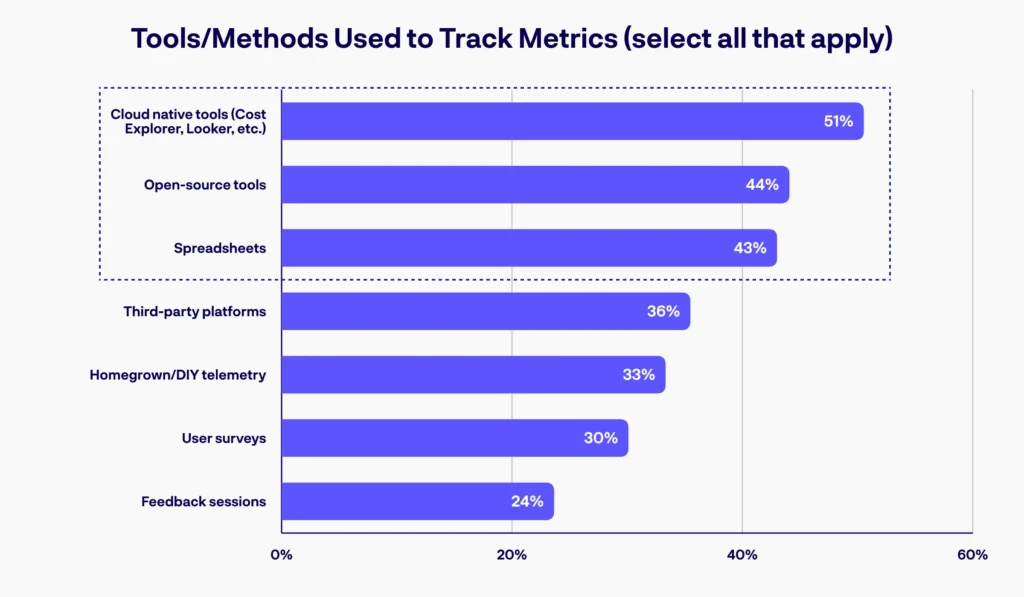
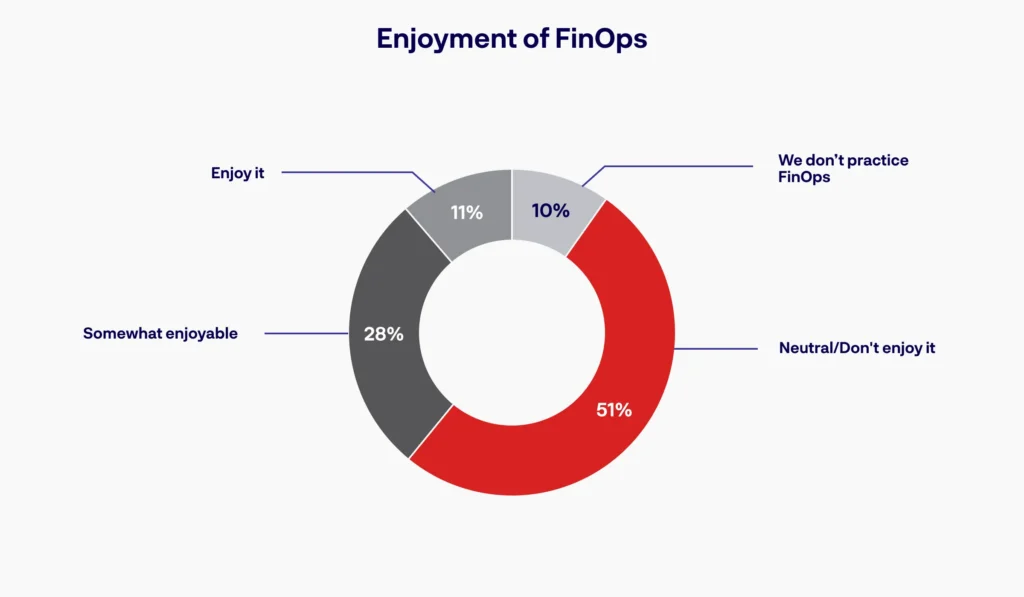
Measuring platform impact in hybrid, multi-cloud environments can quickly become time-consuming. No wonder 51% said “Neutral/Don’t enjoy it” for cost optimization work.
Workload and AI Cost Optimization Lead Priorities for Next 12 Months
Looking ahead, platform engineers were clear about their focus. Asked to rank seven cost optimization initiatives for the next 12 months, 76% ranked “Workload optimization and waste reduction” in the top three, followed by “AI cost optimization” at 65%. 47% said that they will focus on “Enabling automation for FinOps”.
Tackling Cost Optimization Priorities Is a Real Challenge
In a tight economic climate, delivering cost-performant workloads, especially for AI, can be extremely challenging. Ad hoc, DIY measurement methods can’t scale and risk resource burnout.
This is exactly where automated, purpose-built solutions matter: they can continuously optimize workloads and track impact.
How ProsperOps Can Help
ProsperOps continuously optimizes commitment-based discounts (Reserved Instances, Savings Plans, and Committed Use Discounts) across AWS, Azure, and Google Cloud, without ongoing effort, using sophisticated strategies (Adaptive Laddering, Cyclical Optimization, and Active Portfolio Management) to adapt commitments to usage in near real time.
Impact is clearly measured: the ProsperOps console tracks Effective Savings Rate (ESR), a key metric for measuring savings from commitments, which can be benchmarked against industry peers.
Because ProsperOps is self-funding, platform teams can reinvest those savings into new initiatives (e.g., AI-driven IDPs) and resources without asking for a bigger budget.
Start saving now with a free demo.