- Commonly used metrics like utilization and coverage don’t always correlate with savings. Lower utilization and coverage could generate higher savings.
- Effective Savings Rate (ESR) is a simple, single metric that always reflects your actual savings rate. It should be the one metric you seek to maximize and use to measure savings performance.
- If you don’t know your ESR, you’re probably saving less than you think. ProsperOps offers a free, no commitment Compute Savings Analysis that shows your historical ESR trend, as well as future savings potential with a Savings Plan and RI portfolio actively managed by ProsperOps.
This is part 2 of a 3 part series introducing the concept of Effective Savings Rate (ESR). In part 1, we describe what ESR is, why it’s necessary, and how to calculate it. In this post, we’ll look at how existing financial optimization metrics can be misleading and why ESR is the one metric that matters when measuring savings performance. In part 3, we’ll benchmark ESR and discuss great, average, and low ESRs.
“My utilization is 95% so we’re good.” It’s not uncommon for us to hear this and our response is usually the same: “Would you rather have high utilization or high savings?” (you could also substitute coverage for utilization) People generally pause at that question because they equate high utilization or coverage with high savings. Everyone wants high savings, but they measure it via utilization and coverage. The problem with that approach is that both utilization and coverage can be misleading when it comes to actual dollars saved. If your goal is to maximize savings, you need a metric that always correlates with savings. This is Effective Savings Rate (ESR).
The skeptic in you may be thinking, “If ESR is so critical, why hasn’t someone introduced it previously? Utilization and coverage seem to be what AWS and every reporting tool highlight, so aren’t we good?”
The answer is “no!” Keep reading and we’ll prove it to you (we’re skeptics by nature too). We’re not sure why ESR hasn’t been introduced until now. Regardless, as a fully automated discount management service we needed a definitive way to quantify the savings outcomes of every possible portfolio combination. ESR was born from that need and we’ve learned over time just how unreliable other RI metrics can be. Let’s take a look at why ESR is really the one metric that matters.
Quick recap: ESR represents the percentage discount you receive with RIs and Savings Plans across your entire compute fleet (EC2, Fargate, and Lambda), when all is said and done. With resources coming and going, savings instruments being bought, modified, exchanged, and expiring, each with differing discount rates, across multiple AWS accounts, it’s non-trivial to understand your actual savings rate. That’s what ESR does—it’s the ultimate savings truth teller (read part 1 of this series for more background on ESR).
Limitations of coverage
Coverage is a common metric and represents the percent of compute resources “covered” with RIs or Savings Plans. For now, let’s consider RIs, although a similar concept exists for Savings Plans. If you have 10 EC2 instances and five corresponding RIs, your RI coverage is 50%. If four RIs match but one RI doesn’t, your RI coverage is 40%. And so forth.
Since RIs offer a discount, the higher the RI coverage, the more money you’d expect to save, right? If your goal is to maximize savings (which is your ultimate goal), does higher RI coverage mean higher savings? (hint: it’s a trick question)
Consider the following 2 environments, each consisting of the same type and number of EC2 instances:
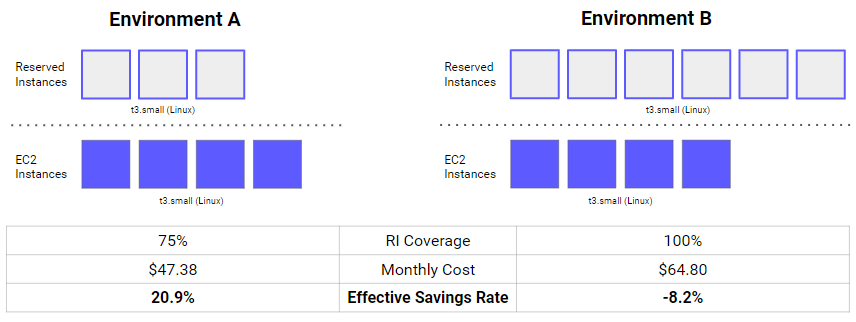
In Environment A, we cover three of our four t3.small instances with RIs and have a coverage of 75%. Not too shabby. With that setup, our monthly cost is $47.38.
In Environment B, we cover all four of our t3.small instances with RIs so our RI coverage is 100%. Nice! But, we also have two extra t3.small RI commitments which do not have corresponding instances. The monthly cost of this environment is higher at $64.80.
Both environments are running four t3.small instances but the environment with lower coverage has the higher savings. This means RI coverage alone can not be trusted to maximize savings.
Something else that might not be obvious is that even with 100% RI coverage in Environment B, we paid more by using RIs than if we just ran everything on-demand at a monthly cost of $55.90. Even with perfect RI coverage, we lost money!
Now, let’s look at ESR for the two environments. We see that in Environment A we saved 20.9%, while in Environment B we had a savings rate of -8.2%. Unlike coverage, ESR accurately reflects the savings dynamic at play. Although coverage doesn’t correlate with savings, ESR always does.
Bottom line: Seek to maximize ESR not coverage.
Limitations of utilization
The second common metric is utilization. This represents what percent of your RI or Savings Plan is being “used” and matches up with corresponding compute resources. Let’s continue with RI examples to keep things simple. If you have 5 RIs that match 4 EC2 instances, your RI utilization is 80%. If that same RI portfolio only has a single matching EC2 instance, the RI utilization is 20%.
As with coverage, you would expect that higher utilization rates equal higher savings. By now you’ve probably realized that’s not always the case.
Consider the following 2 environments, each consisting of the same type and number of EC2 instances:
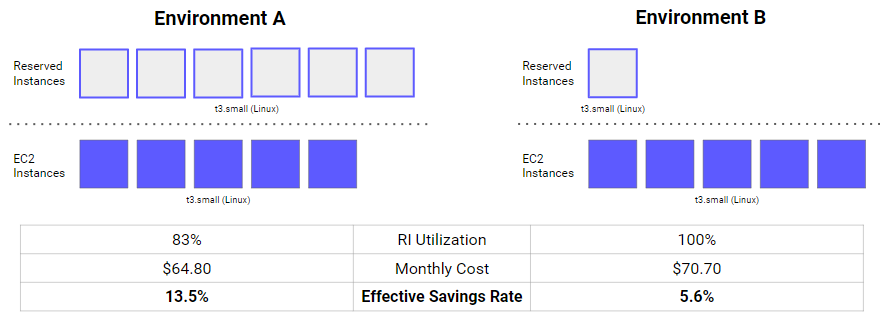
In Environment A, we cover all five of our t3.small instances with RIs but have a single unutilized t3.small RI. Since five of the six RIs have corresponding instances, the resultant RI utilization is 83%. Not too bad. The monthly cost of the environment is $64.80.
In Environment B, which has the same number of t3.small instances, we have a single t3.small RI. Because the RI is matched, the RI utilization is 100%, but the monthly cost is higher at $70.70.
Running five t3.small instances 100% on-demand for a month would cost $74.88. Both the Environment A and Environment B RI portfolios saved us money, but the environment with the lower RI utilization had the higher savings. Again, just as with coverage, utilization alone can not be trusted to maximize savings.
Let’s look at ESR. Does it help reveal the actual savings dynamic at play here? We see that ESR is 13.5% for Environment A and 5.6% for Environment B. So yes, unlike utilization, ESR accurately reflects savings performance. Although utilization doesn’t correlate with savings, ESR always does.
Bottom line: Seek to maximize ESR not utilization.
Limitations of coverage and utilization together
Astute readers and FinOps practitioners might say, “You need to maximize for both high coverage and high utilization together.” OK, but how do you best do that? For example, would you rather have an environment with 80% utilization and 90% coverage or 90% utilization and 80% coverage? It’s unclear which delivers superior savings. Why deal with two metrics when you can simplify down to one metric that always correlates with savings? Simply put, maximizing ESR will always result in maximum savings for you.
There are also other ways of increasing savings that utilization and coverage, even when looked at together, simply don’t account for. For example, consider the following 2 environments, each consisting of the same type and number of EC2 instances:
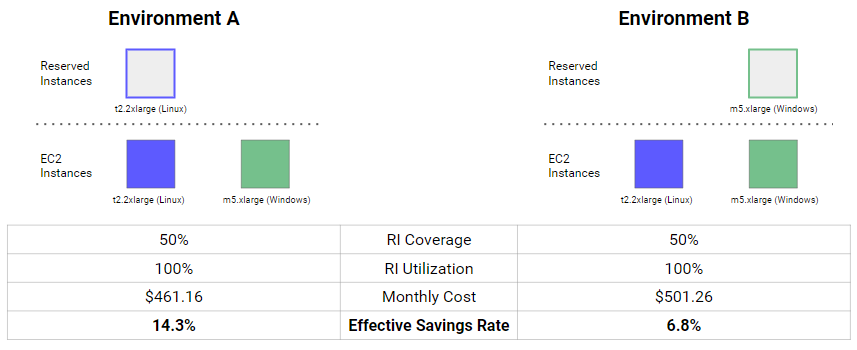
In Environment A, we cover our Linux t2.2xlarge instance with an RI, while in Environment B, we cover the Windows m5.xlarge instance instead. The RI coverage and RI utilization for both environments is identical, but Environment A has a monthly cost of $461.16 while Environment B is more expensive at $501.26 per month. Even with the same RI coverage and RI utilization, savings can still vary!
Again, ESR is our guide and truth teller for savings. The ESR for Environment B is 6.8%, while Environment A is 14.3%, more than twice as much.
It’s important to note here that in either environment, we are making nearly identical on-demand equivalent dollar commits to AWS. In Environment A, we’re covering a Linux t2.2xlarge instance with an annual on-demand cost of $3,251.71 and in Environment B we’re covering a Windows m5.xlarge instance with an annual on-demand cost of $3,293.76. All things being equal, we’re much better off covering the Linux instance due to the higher RI discount rate. A combination of RI coverage and RI utilization doesn’t give us the data we need to maximize savings, but ESR does.
Bottom line: Seek to maximize ESR, not coverage and utilization together.
The above are just simple examples to illustrate the pitfalls of relying on utilization and coverage. The real world is more complex, but the fundamental issues with these metrics remain and are often magnified in practice.
Putting it all together in practice
We talk to lots of customers about AWS savings instruments. When we ask about the effectiveness of current strategies and tooling to deliver savings, we generally see several things:
- Effectiveness is almost always spoken of in terms of coverage and/or utilization, which as we’ve seen above, doesn’t necessarily correlate with actual savings.
- Effective Savings Rates aren’t known (we’re trying to help with that).
- Guesstimates of ESR are almost always higher than what the actual ESR is, once measured. Managing savings instruments is hard and complex work!
It’s not uncommon for us to see a historical savings pattern that looks something like this:
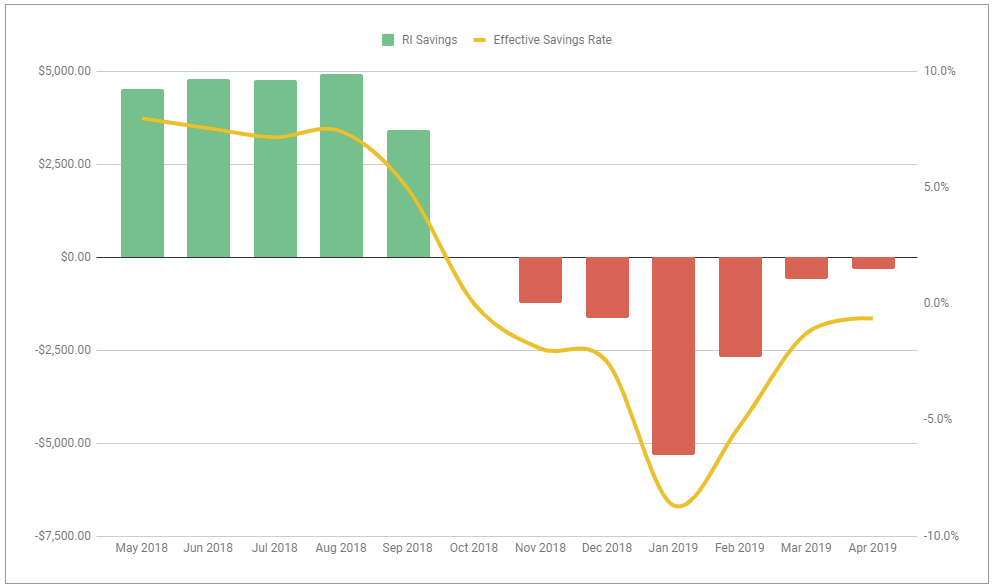
RIs were being used to generate a modest ESR of ~7% (we’ll talk about good and bad ESRs in post 3) but RIs expired, the environment became more complex and elastic, etc. The ESR eventually turns negative, which means the cost of using RIs now exceeds the cost of running all instances on-demand.
Do you know your ESR? If not, you may be saving less than you think, or worse, losing money. Our mission at ProsperOps is to simplify the savings experience (save you time), automate the complex work required to maximize savings (save you money), and ultimately be a part of helping businesses prosper in the cloud.
We offer a free, no commitment Savings Analysis that shows your historical ESR trend as well as future savings potential with a portfolio of Savings Plans and Reserved Instances actively managed by ProsperOps.
Ready to learn more? Sign up for a free, no commitment Savings Analysis.
Prosper on!