
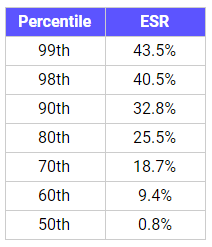
- The average Effective Saving Rate (ESR) is 10.5% with at least 80% of AWS customers achieving an ESR below 25.5%.
- Only the top 2% achieve an ESR above 40% and that is difficult to maintain month after month.
- ProsperOps uses AI, optimization algorithms, and real-time execution to consistently deliver 40+% ESR outcomes, net our charge, with lower risk and no ongoing effort.
This is part 3 of a 3 part series introducing the concept of Effective Savings Rate (ESR). In part 1, we describe what ESR is, why it’s necessary, and how to calculate it. In part 2, we look at how existing financial optimization metrics can be misleading and why ESR is the one metric that always reflects true savings. In part 3 of the series, we’ll benchmark ESR and discuss high and low ESRs.
Background
Since introducing the Effective Savings Rate (ESR) concept in early 2019—which we argue is the single most important ROI metric when it comes to cloud pricing optimization—we’ve evaluated a large number of AWS customers to better understand how well businesses optimize their cloud spend with financial tools like Reserved Instances and Savings Plans. For the first time, we’re sharing that data to help highlight the current state of pricing optimization from our vantage point.
Before we dive into the data, let’s quickly review the fundamental concept of Effective Savings Rate (ESR). There are multiple input metrics available today to help you understand your use of savings instruments (e.g., utilization, coverage). However, none of these metrics answer the fundamental question of “what is my overall savings rate?” (see part 2 to understand more about the limitations of current KPIs). ESR, which measures the blended discount percentage you’re receiving off the on-demand price across your global compute spend, ties every input metric together and provides a single measure of savings performance which is independent of spend levels (i.e., a high ESR is good whether the compute spend is $10K/mo or $10M/mo). ESR is the ultimate savings truth teller – the higher the ESR, the more you save.
Benchmarking Effective Savings Rate
Note: This data set includes 1,300+ data points from ProsperOps prospect Savings Analyses that were run over the course of 2019 and 2020. We only show compute usage through $600,000 per month to make the chart more readable, but the conclusions hold through larger spend amounts into the multi-million dollar per month range.
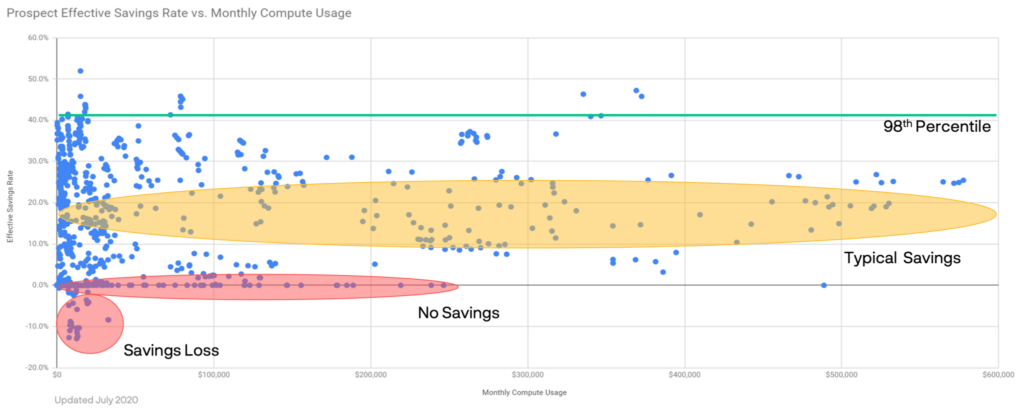
The next step is to understand what constitutes a high and low ESR. To do that, we plotted the historical ESR and monthly compute usage of all prospects that evaluated our service over the course of 2019 and 2020. Against that, we can contrast with the ESR results ProsperOps has autonomously generated for our customers. Together, we can understand the ESR range, distribution, and ultimately what is possible.
In the chart above, the x-axis is monthly compute usage (EC2, Fargate, Lambda) in normalized on-demand equivalent (ODE) dollars. That is, we’ve put all compute spend back at “list price”, unwound any discounts that were applied, removed unutilized commitment, normalized for a 30-day month, etc. This is the purest way to view usage independent of how well savings instruments are currently being leveraged. On the y-axis are the corresponding ESRs customers have historically achieved without our service. Some customers used spreadsheets, some wrote ad-hoc scripts, some used AWS Cost Explorer recommendations, and others used a cloud management platform like CloudHealth, CloudCheckr, or Cloudability.
The average ESR across the data set is 10.5%.
Observations
Here are 5 key observations:
- Losing money is possible. (see red “Savings Loss” circle on chart) It is possible to make commitments that don’t match your actual usage such that you pay more with commitments than if you just ran everything on-demand. In this case, the ESR is negative! We see this more than you would think, even with Savings Plans. While this can happen, it’s generally limited to smaller customers with less than $35K of monthly usage.
- Many users do nothing. (see red “No Savings” oval on chart) Up to $250K/mo in usage (with one outlier at just below $500K), some users choose to forgo savings instruments all together and have a 0% ESR. Lack of awareness, complexity, uncertainty of future usage, and fear of commitment were all mentioned as factors for the inaction.
- The majority save between 10-25%. (see yellow “Typical Savings” oval on chart) The average prospect ESR is 10.5% and 80% of companies save 25.5% or less. This range represents what a typical company might expect to receive off on-demand rates (AWS likes to tout discounts up to 75% off, but no-one actually achieves that in practice). Also note that ESRs in this range are prevalent whether the compute usage is small or large.
- Achieving high ESRs is hard at scale. As spend gets larger, there is increased dynamism, different usage patterns, multiple AWS accounts from different teams/products across the company (and sometimes different companies), etc. It becomes harder and harder to capacity plan and justify the risk vs. reward tradeoffs, so companies hedge their commitments. Note that no companies (save two large usage outliers currently off the chart) with usage above $400K/mo achieved an ESR greater than 27%.
- Elite ESRs are above 40% and are hard to consistently achieve. (see green “98th Percentile” line on chart) Only 2% of companies achieve an ESR of 40.5% of more. Only one customer achieved an ESR greater than 50% by covering ~100% of their usage with Standard RIs, although their usage was relatively small at $15K/mo. This isn’t obvious from the data, but we evaluated that same customer months later and their ESR had dropped significantly because their environment had shifted and the RIs became unutilized. Not only is breaking a 40% ESR difficult, but it’s also hard to maintain month after month.
It’s important to note that max ESR is impacted by region and platform. If you are a Windows-only shop running in an obscure region (both of which drive lower discounts), your ESR will naturally be limited, even if you achieve a perfect 100% coverage and utilization with 3 year, all upfront commits.
Safely and consistently achieving a world-class ESR is possible for everyone
We founded ProsperOps to bring world-class savings outcomes to everyone. We got frustrated with customers consistently achieving average or below average savings outcomes, even with the best reporting tools and training. We knew there had to be a better way and that AI, optimization algorithms, and real-time execution engines could deliver perfect discount management outcomes that would exceed even the most accomplished FinOps practitioners (just as with chess, the computer will eventually outperform the human).
However, there turned out to be another critical element that we didn’t realize until after we got going: risk. Achieving a 40+% ESR requires achieving deep discounts with near-perfect utilization and extremely high coverage. But how do you do that safely? To manage risk, most companies hedge their coverage (and rightfully so), but this means they will never achieve world-class savings outcomes.
One of the unique and powerful aspects of our service is our ability to reduce commitment, if necessary. This means we can safely generate discounts on 95+% of usage as it trends both up and down, in near-real time. That, as well as many other advanced techniques we leverage, allow us to deliver a minimum of 40+% ESR outcomes for Linux customers, and 30+% ESR outcoming for Windows customers – guaranteed, and net of our charge. With our service, it’s only a matter of time before you’ll automatically be achieving a world-class ESR month after month, with no ongoing effort. You have more important work to do than discount management. Let the ProsperOps service do the work instead.
Impact
You might be thinking an average ESR is good enough. If so, you may not be our customer and the good folks in Seattle thank you for your patronage. But if you are keen to maximize your savings while at the same time removing risk and effort, it’s easy to quantify the impact of improving your ESR. Let’s say you have $100K of monthly compute usage and your current ESR is 15%. That means you are saving $15K a month which is above average. Not bad. But with ProsperOps, we can take your ESR to 40% (after our charge), which means you’ll have a net month savings increase of $25K/mo or $300K/year. That’s real money that gets added back to your budget to spend on other services, hiring, improving your margins, or whatever you want.
At larger usage amounts, moving the ESR needle even a few points can generate significant incremental savings. Assume you are spending $3M/mo on compute and have achieved an ESR of 35%. Moving that to 40% would generate an additional $1.8M of savings a year!
Seeing is believing. If you’d like to understand your historical ESR and what ProsperOps can do for you, we offer an easy, completely free and no obligation Savings Analysis. Our mission is to help every business achieve world-class savings outcomes so they can prosper in the cloud and we’d love to do that for you.
Prosper On!