
Introduction
Public cloud IT spending across the three main hyperscalers — Amazon Web Services (AWS), Google Cloud Platform (GCP), and Microsoft Azure — will reach an estimated $200B by the end of 2023, with a significant amount attributed to compute spending (source: Synergy Research Group).
Based on our analysis of customers’ cost and usage data for organizations ranging in size from small businesses and startups to Fortune 500 enterprises across various industries, roughly 50% of the average AWS bill consists of compute services (i.e., EC2, Fargate, Lambda, ECS, EKS). This is likely higher for all organizations on AWS, since our customers who use our cost optimization solution tend to be more efficient with compute. As a result, optimizing cloud costs for compute services can have a significant impact on your organization’s overall cloud bill.
Rate optimization is an ongoing process whereby teams can modify and manage how they pay for cloud services. By analyzing current and historical cloud cost and usage data (e.g., AWS Cost and Usage Report), cloud financial management teams can realize savings through the use of commitment-based discounts, volume-based discounts, enterprise discount programs and/or alternate pricing models, such as Spot instances.
By closely managing the pricing aspects of cloud services, your organization can reduce cloud costs and return valuable savings to your budget. According to the FinOps Foundation, the Rate Optimization domain answers the question:
How can I optimize how I pay for cloud services to achieve better price performance?
The 2024 Effective Savings Rate Benchmarks and Insights report will help you baseline your AWS compute rate optimization performance against peers, so you can understand the relative success of your cost optimization initiatives and prioritize other FinOps initiatives accordingly.
Key Statistics
50%
Average percentage of AWS bill comprised of compute services (e.g., EC2, Fargate, Lambda)
0%
Median Effective Savings Rate (ESR) across all analyzed organizations
23%
Effective Savings Rate for organizations ranking in the 75th percentile
53%
Percent of organizations who do not use AWS Savings Plans or Reserved Instances (RIs)
38%
Percent of AWS organizations using Savings Plans
67%
Percent of ProsperOps customers that achieve a 2x increase in savings with our automation
Effective Savings Rate
You may be familiar with cloud cost optimization metrics like coverage, utilization, and discount rate, which are common rate optimization input metrics. However, only Effective Savings Rate (ESR) accurately measures your true savings performance.
Think of ESR as being similar to the ROI metric you would expect in financial contexts. ESR is an objective FinOps metric that can be applied to understand your ROI on cost optimization activities. ProsperOps uses ESR to measure the success of our automated rate optimization service. Effective Savings Rate has been adopted by both the FinOps Foundation and AWS as a core cost optimization KPI. In fact, you can now view your Effective Savings Rate in the Billing Summary tab on the AWS Cost and Usage Dashboard.
ProsperOps uses ESR within our console as the north star KPI. By optimizing for a higher ESR, we help our customers maximize their savings and return the most money back to their cloud budget.
Methodology
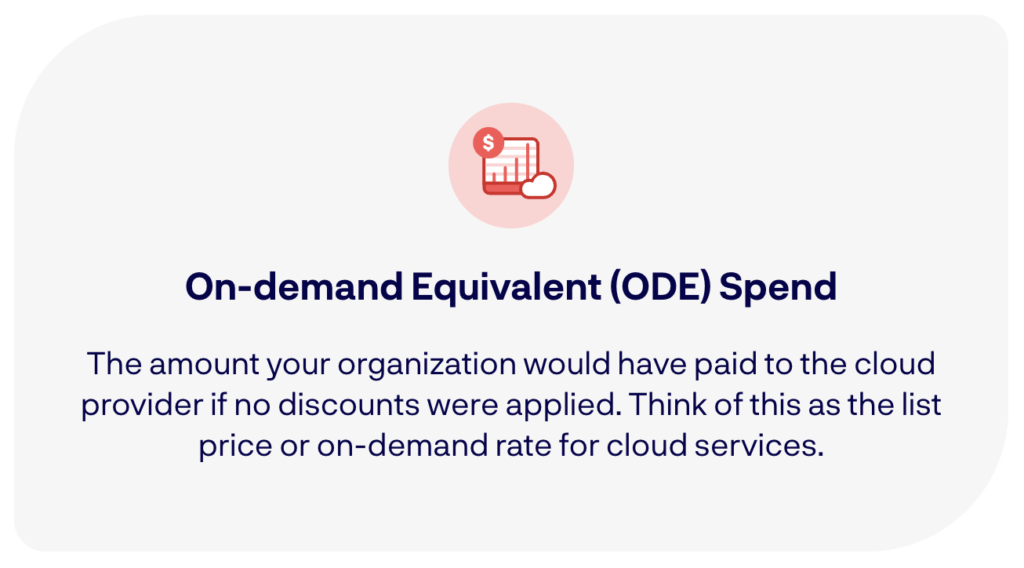
ESR is the aggregate discount off the on-demand rate for cloud services, applications, and infrastructure.

Our analysis includes an in-depth review of thousands of anonymized data points from AWS Cost and Usage Reports, including usage, coverage, and spend. Data was collected and included from AWS organizations over a 12-month period. This report and insights are based on a twelve-month lookback of data collected prior to the latest (most recent) cloud savings analysis performed, after December of 2022.
For example, Org A has cloud cost and usage data available from January 2022 through December 2022. Org B has cloud cost and usage data available from February 2022 through January 2023. Both have 12-months of data, but not from the exact same 12-month period.
Combined, these organizations represent over $1.5B in annualized AWS compute usage. To avoid skewing the data higher than it should be, our analysis was limited to prospect accounts, meaning this data comes from organizations before they began using ProsperOps to autonomously optimize their commitments.
For this year’s ESR Benchmarks and Insights report, we focused on measuring ESR specifically for cloud compute services — EC2, Lambda, and Fargate — and excluded Enterprise Discount Program (EDP) and/or Private Pricing Agreement (PPA) discounts, because those cost-cutting measures are not openly available. This ensures our analysis compares like-for-like savings from discount instruments that are available to all organizations — a more equitable approach.
Insights
Six key insights from our analysis of cost, usage, and savings data.
Insight 1
Rate optimization outcomes are generally poor, and there is material room to improve your ESR.
The median ESR on cloud compute services across all organizations was 0%, meaning many AWS customers leave money on the table by simply paying on-demand rates rather than leveraging discount instruments to reduce cloud costs. Even at the 75th percentile, we found that ESR was only 23%, which is to say those organizations are generating a 23% discount (savings) on every dollar they would have paid for the service at the on-demand rate, prior to any EDP or PPA discount.
Percentile
Monthly Compute ESR
98th
46%
75th
23%
50th
0%
25%
0%
Min
-9%
It is important to note that there are engineering choices teams can make that will positively or negatively impact your ESR. For example, AWS provides discounted pricing based on different criteria, including region, instance family, operating system (e.g. Linux, Microsoft), workload volatility, and type of discount instrument used. All of these factors can affect your ESR, either favorably or unfavorably.
To illustrate this point, all other things being equal, an instance running a Linux operating system will cost less than an instance running a Microsoft operating system, and running an instance in Oregon will cost less than running it in Sydney.
Insight 2
Rate optimization is underutilized as a way to generate savings.
Of the organizations we analyzed, 53% were not utilizing any commitments (e.g., AWS Savings Plans or Reserved Instances). This may be because of the convention that rate optimization should follow engineering (usage) optimization or due to the complexity of managing discount commitments.
Historically, it may have made sense to prioritize engineering and usage optimizations ahead of rate optimizations. This is because, without an automated FinOps solution like ProsperOps, once a commitment was purchased, it could not be easily modified or scaled down, as engineering changes are made to reduce usage. However, with ProsperOps, customers can make engineering and usage optimizations at any time, because our automation builds and aligns a dynamic commitment portfolio to your usage changes in real-time. This paradigm shift allows organizations to start rate optimization in parallel with engineering and usage optimization.
In reality, engineering and usage optimization is a resource-intensive process requiring ongoing input and direction from engineering teams. With ProsperOps, rate optimization can be fully automated, eliminating the need to manually manipulate and optimize commitments as usage increases or decreases.

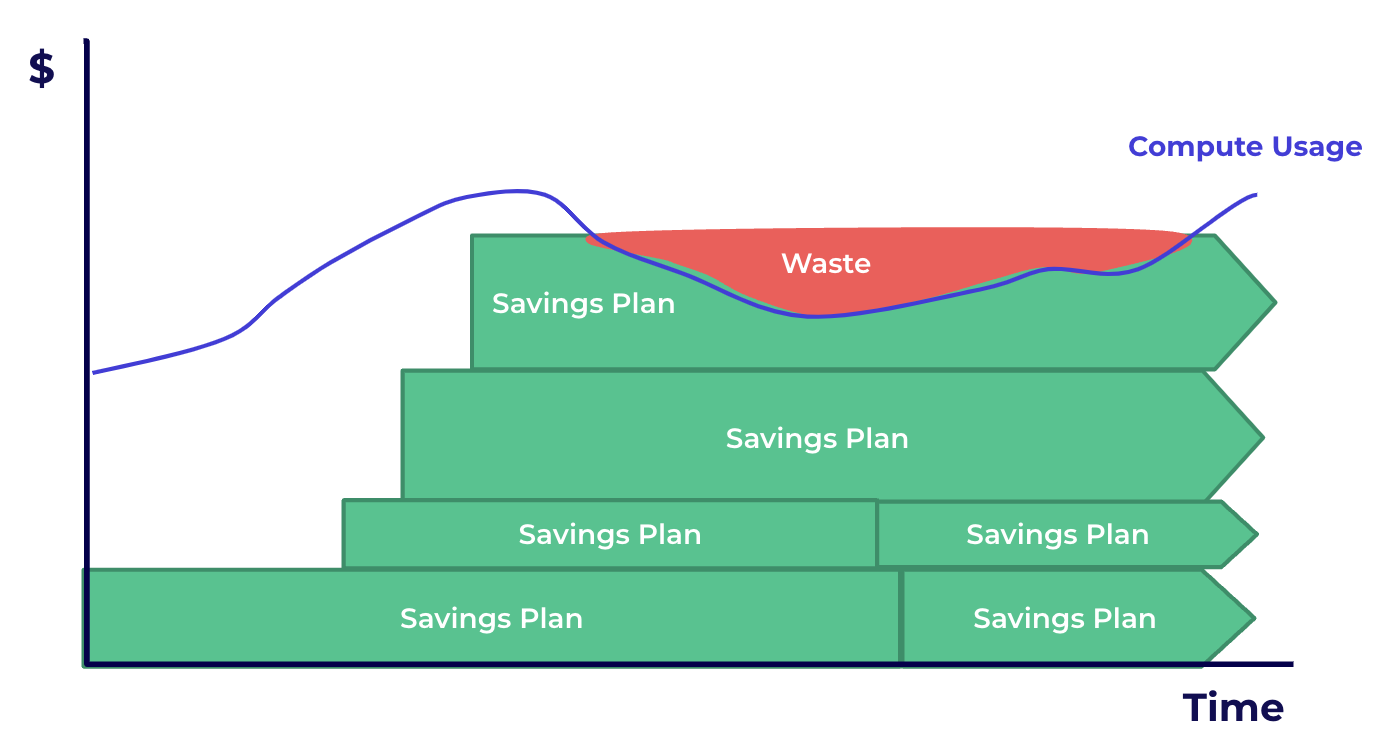
Savings Plans were the most popular discount instrument, used by 38% of all organizations analyzed. This is likely because they are relatively easy to implement, highly recommended by AWS, and require little to no effort once purchased. The downside is that AWS Savings Plans require immutable, long-term commitments and can seamlessly scale up, but can not scale down. It is common to see organizations stack, or ladder, multiple Savings Plans as usage increases over time, but incur over-spending when engineering changes or environmental factors cause a sudden and dramatic drop in usage, as illustrated below.
In our analysis, we found the percentage of organizations using Savings Plans (38%) was more than double the number of organizations utilizing AWS Standard Reserved Instances (18%), which is surprising considering SRIs have been in use longer than AWS Savings Plans. AWS introduced the Standard RI in 2009 as a new Elastic Compute Cloud (EC2) pricing model, and it wasn’t until November 2019 that AWS introduced Savings Plans.
One of the biggest differences between AWS Savings Plans and Reserved Instances is related to pricing and the savings offered. Savings Plans can be applied to a wider range of AWS compute types, whereas Reserved Instances require you to commit to specific instance types and attributes. Also, Standard RIs may be exchanged on the Reserved Instance Marketplace, though there are limitations. Organizations should familiarize themselves with the updated AWS Standard RI Marketplace Service Terms.
Read more about how AWS Savings Plans are different from Standard Reserved Instances.
Out of all AWS discount instruments, Convertible Reserved Instances (CRIs) are used the least — only 14% of organizations we analyzed use CRIs. At ProsperOps, we value Convertible RIs because they are the only discount instrument that allows you to change point-in-time commitment amounts, unlike SRIs, which require counterparties for exchanges on the Standard RI Marketplace. This means that CRIs are very flexible, allowing you to modify them easily and match your new workloads.
For most companies that have dynamic and uncertain environments, it would be hard to achieve optimal savings with Savings Plans alone. We think that CRIs paired with Savings Plans is a robust strategy that generates top-tier savings performance and reduces commitment risk.

Insight 3
Overall, ESRs increased in 2023, but not always sustainably.
In the past two years, many organizations have emphasized a renewed commitment to operational efficiency. So, it’s not surprising to see our data suggesting an overall improvement in ESRs. In fact, the average ESR at the 75th percentile increased from 21% to 26% between 2022 to 2023.
However, considering the broader economic context, it’s clear technology companies have taken dramatic steps to reduce their overall compute usage by simply turning off services and/or making engineering and usage optimizations to reduce cloud services being used. In response to the recent global pandemic and economic headwinds, your organization may have done the same. This decline in usage directly correlates to an increase in coverage and, as a result, can improve your ESR. The question we must ask ourselves is if your ESR improvements are sustainable or a temporary result of cutting usage.
The AWS Q3 Earnings Report shows that revenue growth stayed flat compared to the previous quarter, suggesting that we may be closer to the end of the downward trend, and growth is likely to resume in 2024. To sustainably maximize your ESR, cloud FinOps teams need to focus on increasing savings through rate and usage optimizations rather than simply decreasing usage by turning things off.

Insight 4
Compute usage and Effective Savings Rate are correlated.
Looking across our dataset, we compared total compute usage and Effective Savings Rate side-by-side. We found that companies with low compute usage (spending less than $1M/year) had far lower ESRs than companies with higher compute usage (spending more than $5M/year).
While compute usage may not have a causal impact on ESR, they are correlated. This may be influenced by a number of factors:
- Resources and expertise in cloud FinOps, DevOps, and cloud cost optimization
- Economic gain — underestimating the impact of rate optimization relative to other cost optimizations
- Reliance on inflexible discounts (e.g., Savings Plans) increasing the risk of overcommitment when maximizing coverage
- Younger and smaller companies with lower compute usage are also more likely to have uncertain futures. They may be more likely to purchase 1-year commitments rather than 3-year commitments; even though 1-year commitments provide lower discounts, they may be more attractive to younger companies that want more flexibility and lower risk to changes that may occur to their businesses.
Percentile
Monthly Compute ESR
Coverage
75th
15%
53%
50th
0%
0%
25th
0%
0%
Percentile
Monthly Compute ESR
Coverage
75th
31%
86%
50th
20%
70%
25th
10%
36%
Percentile
Monthly Compute ESR
Coverage
75th
40%
91%
50th
34%
83%
25th
26%
71%
Not surprisingly, companies that spend more on cloud (higher compute usage) also save more on cloud (higher ESR). Based on our data, we believe this is due to more resources and practices focused on cloud rate optimization.
Another likely reason is that some of these companies spending more on cloud are at a stage in which their business and usage are growing rapidly. This favorable and steady growth in cloud usage creates a situation where you can keep buying discounts, cover usage aggressively, and generate a high ESR. Note, this only works as long as you continue to grow. If growth stalls and spending is cut, or priorities shift, a drop in usage leaves you in an overcommitted state and lowers your ESR, potentially into negative territory.
Insight 5
A marginal improvement in ESR can deliver material savings.
Even for organizations with high usage, spending >$5M annually, and high Effective Savings Rate (95th percentile), a marginal improvement in ESR can result in massive cost savings in the cloud.
Organizations with very high usage may believe their ESR is fully optimized, but with the right automation and solutions in place, you can increase your ESR and generate substantial cloud savings.
For example, if your organization spends $10M annually on cloud services, and you achieve a five-percentage point improvement in your Effective Savings Rate, you would generate $500K in annual savings returned to your bottom line, which can be used to hire more software engineers.
Annual Savings = Compute Usage x ESR Improvement = $10M x 5% = $500K
Insight 6
To maximize savings and avoid risk, world-class ESRs require automation.
Cloud discount instruments, like Savings Plans and Reserved Instances, each have unique benefits and drawbacks. The best approach is to build a dynamic portfolio, managed and optimized with automation. Automated cost optimization software can align your discount commitments to usage with near-perfect (99%) coverage and optimal utilization. Even in environments with high volatility — sudden, planned or unplanned changes in usage — automation helps you achieve better outcomes.
Especially with complex environments and constant usage changes, automation is faster, less error-prone, and more responsive than trying to manage commitments manually.
If you don’t know your ESR, sign up for a free Savings Analysis and demo with ProsperOps here. We’ll help you understand your savings performance and ESR step-by-step.
Discover your ESR and Cloud Savings Potential
Learn how to implement automated cloud financial management tools to improve visibility, manage risk, and minimize waste. Check out our three-part video series on FinOps automation — understanding your options, measuring success, and streamlining cloud financial management.
What should I do based on my ESR?
Already know your company’s ESR? Take a look at the following graphic that segments organizations based on annualized compute usage and ESR.
Where does your organization land?

ProsperOps recommendations for improving your ESR:
Negative ESR (<0%)
You pay a premium over the on-demand rate for compute, likely due to overcommitment and/or underutilized commitments. In other words, your usage and commitments are mismatched. Consider unwinding commitments, like letting your Savings Plans expire. If you have Standard Reserved Instances (SRIs), you list them for sale in the AWS RI marketplace. If you use Convertible Reserved Instances (CRIs), you can get help from an automation platform like ProsperOps.
Below Average ESR (0% – 23%)
If you have a low ESR, below the 75th percentile, you have significant economic upside to improve your ESR and rate optimization. Automation can help you adapt to changes in the future, whether planned or unplanned, and reduce manual commitment management. Consider a portfolio that includes AWS Savings Plans and Convertible RIs.
Low Usage, Above Average ESR (<$500K/yr, >23% ESR)
Keep in mind, your ESR is measured at a point in time and can fluctuate daily. To consistently achieve high ESR, you need to ask yourself if your current ESR is sustainable, and how your usage will change in the future.
If you are only decreasing usage, then your ESR increase is likely temporary. Going forward, as your organization increases usage — especially in volatile environments — Savings Plans paired with Convertible RIs are your best bet.
If your ESR is consistently high and you don’t anticipate any usage changes in the future, then you are doing great. However, maintaining stable and consistently high commitment coverage and utilization is extremely difficult — we rarely see this usage pattern and consistently high ESR.
High Usage, Above Average ESR (>$0.5M/yr, >23% ESR)
If your ESR is consistently high and you don’t anticipate any usage changes in the future, then you are doing great. However, maintaining stable and consistently high commitment coverage and utilization is extremely difficult — we rarely see this usage pattern and consistently high ESR.
Questions to ask yourself:
How much incremental value can you get from maximizing your ESR?
For instance, what is the value of increasing ESR from the 80th to 98th percentile? (increasing from 40% to 46% ESR)
Is your cost optimization strategy sustainable?
Do you anticipate declines in your usage from future engineering optimizations? A Savings Plans-only strategy would put you at risk of overcommitment. Would it be better to deploy more flexible discount instruments?
Can you offload manual commitment management to automated technologies, so you can focus on other priorities?
If you are operating at scale, you may be considering or have an EDP or PPA. A more flexible rate optimization strategy with automation allows you to systematically align commitment expiration dates with your EDP or PPA terms. This way, you have more leverage during PPA and EDP contract negotiations or during renewal discussions with AWS.
Need help calculating your Effective Savings Rate?
About ProsperOps
ProsperOps is the FinOps Automation Platform that optimizes on discount commitments, so that you can save 50%+ on your cloud compute spend. This level of savings puts ProsperOps customers in the 98th percentile of cloud cost optimizers.
Engineering and FinOps teams are overloaded with work and every new solution creates tradeoffs, except with ProsperOps. ProsperOps makes no changes to your infrastructure or engineering processes and does not create distractions or overhead for your team. It operates silently behind the scenes without the constant human interaction required by less automated solutions. Implementation takes minutes, and results start immediately.
Without intelligent automation, 80% of companies only achieve an Effective Savings Rate of 20% off the on-demand rates — well below the 60% discounts advertised by cloud providers and RI brokers.
With ProsperOps, our platform uses AI and automation to analyze real-time data points — against a backdrop of 134 million instances under management — to double effective savings rates (up to 50%) without requiring engineering support or technical trade-offs.