In February of 2021, the FinOps Foundation published its inaugural community-focused report entitled The State of FinOps 2021. It combines results and data from a 44-question survey of 804 FinOps practitioners, managing over $30 billion in combined cloud spending.
This blog highlights takeaways from the 2021 State of FinOps report.
Key Findings
Top trends from the 2021 State of FinOps report include:
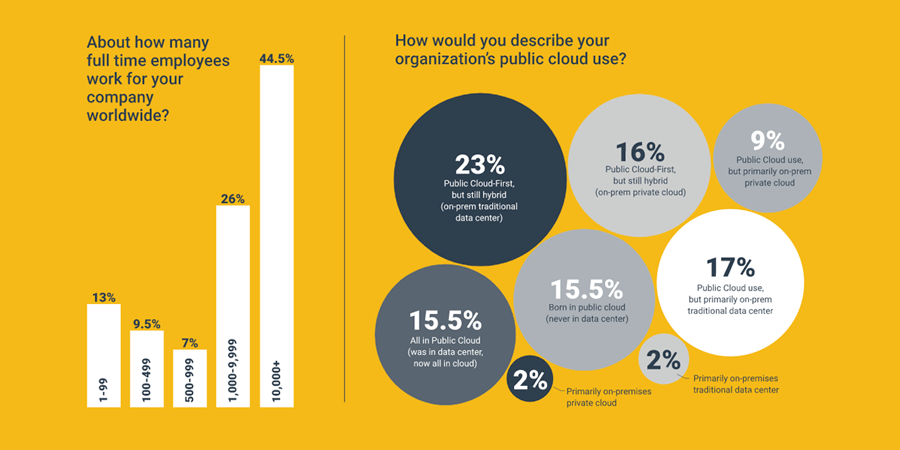
- Large organizations (more than 1,000 employees) are driving the adoption of FinOps
- Roughly 31% of organizations are only in the Public Cloud, using no on-prem or private cloud resources
- Average experience for FinOps practitioners in the Run stage is 3 years; Walk stage is 1 year
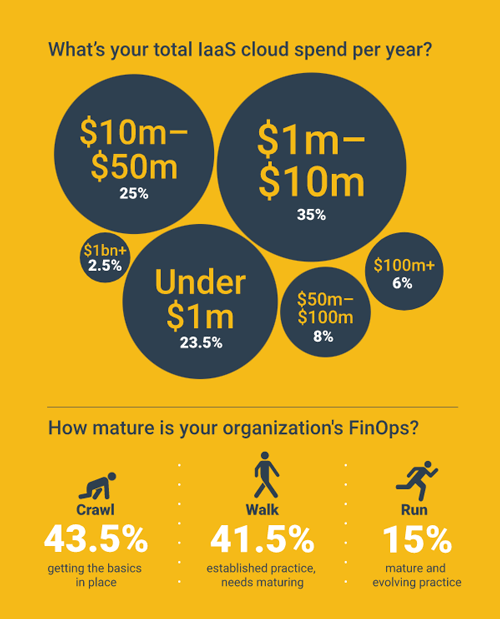
- Just over 43% of organizations consider themselves in the Crawl stage, getting FinOps basics in place
- Most FinOps practitioners (38%) are based in North America, followed by Europe / Middle East (30%) and United Kingdom (11%)
Companies can do more with FinOps
There’s no question the public cloud is growing – and fast. As more organizations adopt and take full advantage of the cloud, they are learning to leverage FinOps to optimize how they build and buy cloud services.
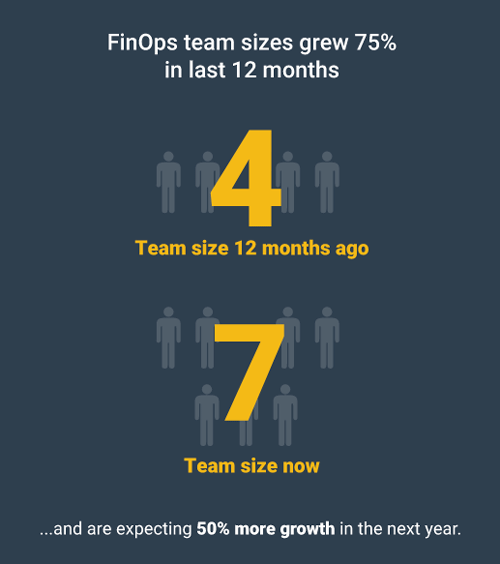
FinOps team sizes grew 75% from the previous year, going from an average of 4 to 7 people. Double-digit growth is also expected in 2022, creating the need for more FinOps specialists and experienced, senior team members.
Even with all this growth, most companies operating cloud financial management programs can do more.
Most FinOps teams are crawling
The 2021 State of FinOps indicates that the majority of teams are just beginning their FinOps journey, in the “crawl” stage. Even as adoption of the public cloud accelerates, cloud cost management remains a key challenge.
Over 75% of companies have a cloud spend of over $1MM—with 41% of these teams spending over $10MM and 16% spending over $50MM. Yet, only 15% of all organizations reported that they consider their FinOps program mature or well-optimized.
FinOps team structure
Cloud FinOps team structures and personas vary. Roughly 33% of FinOps teams are dedicated, while 44% of respondents reported that their FinOps team is part of a larger department, such as the Cloud Center of Excellence (CCoE).
Most practitioners responsible for cloud cost management and financial operations fall into three categories:
- FinOps, Cloud Financial Management (43%)
- DevOps, IT/Engineering (26%)
- Executives (11%)
Over 31% of respondents indicated that their FinOps team reports into a CTO, roughly 27% report into a CIO, followed by 13% who report into the CFO.
Which FinOps KPIs are important?
According to respondents, these metrics set the bar in how to measure your cloud financial performance:
- Usage and total cloud spend
- Usage efficiency (rightsizing, autoscaling, etc.)
- Savings instrument coverage
- Reserved Instance (RI) utilization
- Unused assets
- Cost savings
With the cross-functional nature of FinOps, there’s no surprise that the survey garnered hundreds of different answers as to what KPIs FinOps teams should measure.
FinOps needs engineers to take action
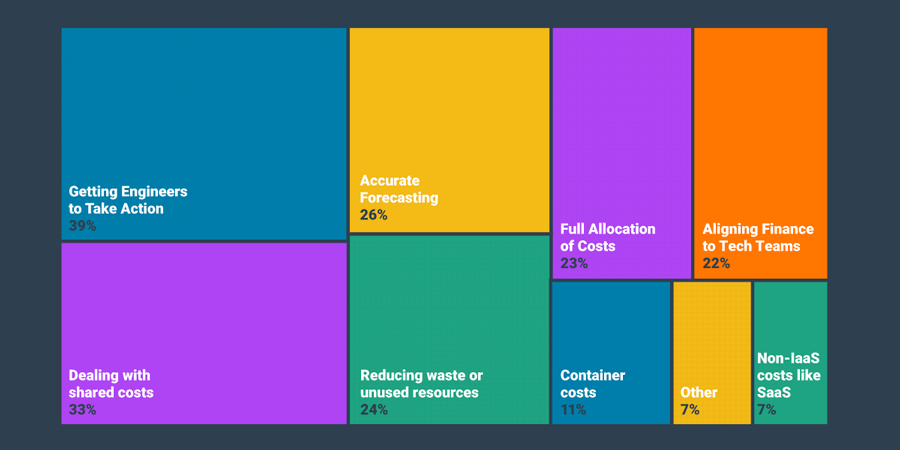
The biggest pain points and roadblocks for cloud financial operations teams remain almost identical irrespective of organization size or cloud spend. And the resounding challenge faced by almost all FinOps teams, with 39% ranking it as a top challenge in their practice, was getting engineers to take action.
What isn’t identical, however, is how FinOps is prioritized internally. Startups prioritize growth over profitability, but as organizations mature, maintaining profitability becomes more important, so FinOps is adopted to help decrease cloud costs, reduce waste, and improve forecasting.
This is how survey respondents ranked common FinOps challenges:
- Getting engineers to take action (39%)
- Dealing with shared costs (33%)
- Accurate forecasting (26%)
- Reducing waste or unused resources (24%)
- Full allocation of costs (23%)
- Aligning Finance / Tech teams (22%)
- Container costs (11%)
- Other (7%)
- Non-IaaS costs like SaaS (7%)
These challenges exist consistently across organization size and FinOps maturity. Knowing this, crawl-stage FinOps programs might develop processes designed to get engineers to take action. Companies new to cloud computing should also prioritize shared costs, forecasting, and reducing waste to avoid future growing pains.
Learning FinOps and cloud financial management
To stay sharp and overcome their FinOps challenges, practitioners turn to the following FinOps resources:
- FinOps Foundation – 78%
- Cloud Management product blogs (CloudZero’s blog is among our favorites) – 38%
- AWS’s blog – 27% (check out the AWS cloud financial management blog)
- Last week in AWS – 16%
- Azure’s blog – 9%
- Google’s blog – 6%
FinOps teams prefer native cloud tools
When organizations adopt FinOps, what is the primary technology used for cloud financial management and operations?
The majority of FinOps teams prefer native cloud cost management tools, with roughly half (46%) of respondents reporting their primary technology consists of native cloud cost management products and tools.
Almost the same percentage of teams (43%) leverage third-party platforms as their primary FinOps tech, with the remaining 11% of teams using home grown FinOps tools, scripts, and spreadsheets for cloud financial management and operations.
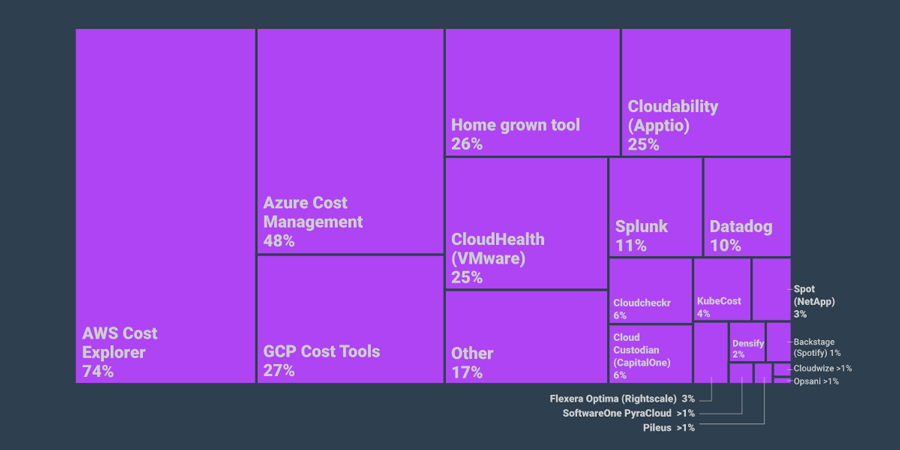
According to the 2021 State of FinOps respondents, here’s what you’ll find in the typical FinOps practitioner’s toolkit:
- AWS Cost Explorer – 74%
- Azure Cost Management – 48%
- Google Cloud Platform (GCP) Cost Tools – 27%
- Homegrown tool(s) – 26%
- CloudHealth (VMware) – 25%
- Cloudability (Apptio) – 25%
- Other – 17%
- Splunk – 11%
- Datadog – 10%
- Cloudcheckr – 6%
- Cloud Custodian (CapitalOne) – 6%
- KubeCost – 4%
To view the full list, reference the 2021 State of FinOps Report here.
Target vs. Actual coverage for RIs, Savings Plans, and CUDs
Most cloud financial management teams set their sights high: Run-stage teams target 80%, Walk-stage teams target 75%, and Crawl-stage companies target 60% commitment coverage. In reality, FinOps teams fail to meet their target coverage rates, independent of maturity.
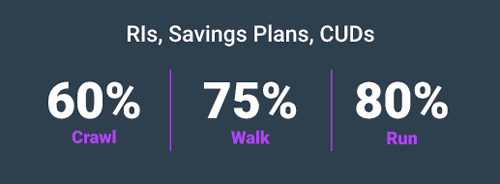
Actual report coverage rates:
- Crawl-stage FinOps teams – 40% (target 60%)
- Walk-stage FinOps programs – 53% (target 75%)
- Run-stage FinOps programs – 62% (target 80%)
When it comes to covering usage with a discount instrument, it’s clearly easier said than done. Ongoing environment changes, usage volatility, and management complexity account for just some of the variables that make discount commitments difficult to administer.
What’s next for FinOps?
The FinOps Foundation conducts this report to understand current cloud financial management trends, how FinOps teams are evolving, and what we might expect in the future. From the 2021 State of FinOps report findings, three themes emerge:
- Equip and enable engineers.
The top answer from survey respondents when it came to identifying their biggest FinOps challenge: Getting engineers to take action. Cloud financial management teams should ask themselves two questions. First, why aren’t engineers taking action? Second, what can we do to enable and encourage engineers to take action?
This resource from the FinOps Foundation is all about getting engineers to take action. - Close the coverage gap.
In a perfect world, cloud financial management teams would hit—and even exceed—coverage targets. Not to mention, max out their discount utilization, discount percentage, and overall Effective Savings Rate. Unfortunately, this rarely happens. In fact, only the top 2% of all organizations optimizing AWS costs achieve an ESR of 40% or more.
Independent of maturity, most cloud financial management teams fail to reach even 80% discount coverage. All other cloud cost metrics being equal, as coverage increases, costs decrease. So, there’s a financial incentive directly tied to maximizing your commitment coverage. - Embrace automation.
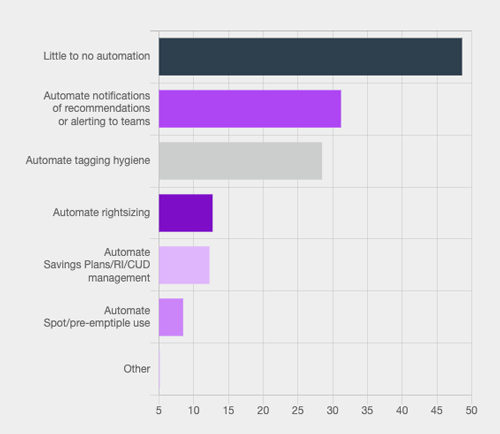
Roughly half of all respondents—and 70% of walk-stage FinOps teams—have little or no automation in place. Teams who are leveraging automation are doing so to: streamline sending recommendations (31%) and streamline tagging hygiene (29%). A smaller subset of teams automate rightsizing (12%) and the management of savings plans and RIs (12%).
ProsperOps can support your FinOps journey across all three of the above recommendations, by:
- Automating the management of cloud discount instruments—including AWS Savings Plans and Reserved Instances—to unlock greater flexibility, savings, and efficiency.
- Helping you close the coverage gap, programmatically achieving near-perfect utilization and coverage rates of 98%, or more.
- Eliminating engineering bottlenecks and manual cost optimization tasks, autonomously aligning commitments and reservations to your usage in near real-time.
Read our takeaways from the FinOps Foundation’s 2022 State of FinOps report.
Schedule a demo or request a free Savings Analysis to learn more about our automated cloud cost optimization tool.