

- Managing RIs and Savings Plans with input metrics like utilization and coverage doesn’t tell the full story and can be misleading.
- Effective Savings Rate (ESR) is the ROI for savings instruments, and is the one output metric you can use to measure true savings performance.
- Most people don’t know their ESR and overestimate their actual savings rate.
This is part 1 of a 3 part blog series introducing the concept of Effective Savings Rate (ESR). In this post, we cover the problem, introduce you to the ESR formula, and help you understand how ESR calculations work. In part 2, we’ll look at limitations of existing savings instrument metrics and why ESR is the one metric that ultimately matters. Lastly, in part 3, we’ll benchmark ESR and discuss great, average, and low ESRs.
The Problem
We like to use analogies from the world of personal investing to explain the philosophies behind how ProsperOps manages a savings portfolio, including Reserved Instances and Savings Plans. Consider the following dialog between an investor and her financial advisor:
Investor: How are my investments doing?
Advisor: Good. We’ve deployed 93% of your money and covered a variety of asset classes.
Investor: OK. How much money have I made?
Advisor: Well, we’re holding 15% of your investments in a small cap index fund that has grown 4% this quarter, and another 10% in a REIT, and…
Investor: Yeah, but what is my overall rate of return?
Advisor: Hmm, not sure. We don’t track that.
While this conversation should never happen in practice (let’s hope), it illustrates the point that while investing has lots of input metrics, the one metric that ultimately matters is an output metric—Return On Investment (ROI). Whether you invest yourself, use a human advisor, or use a robo-advisor—the objective is to achieve the maximum ROI for a given risk profile. ROI is fundamentally how investment performance is evaluated.
We talk to AWS users about their savings outcomes all the time and when we ask if they can quantify the effectiveness of their current strategy, they don’t know their ROI. Historically, they speak in terms of input metrics like utilization or coverage. These aren’t unimportant, and in fairness AWS speaks in those terms, but they don’t answer the fundamental question about savings performance. How do you know if you’re excelling, saving an average amount, or vastly underperforming your potential?
Introducing Effective Savings Rate
Because ProsperOps delivers automated savings outcomes (vs. passive recommendations), we defined a quantifiable measure to assess the effectiveness of our algorithms. We call that metric Effective Savings Rate (ESR), and similar to ROI, it’s the one number that measures bottom-line savings performance.
Using “effective” rates is quite common in financial analysis. For example, if you’re a TurboTax user, your completed tax return will include the following summary:
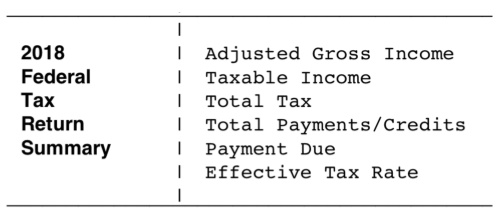
Note the final item—Effective Tax Rate. A tax return has many factors that contribute to how much you owe: graduated tax brackets, short and long term capital gains, deductions and credits, etc. However, when all is said and done, you want to know your Effective Tax Rate (or maybe not ).
The same is true with savings instruments. Take RIs, for example. There is RI utilization, RI coverage, different RI types with varying discount rates, etc. However, when all is said and done, you want to know your Effective Savings Rate. Effective Saving Rate, which for our purposes encompasses Savings Plans and RIs across EC2, Fargate, and Lambda, can be calculated as follows:

Actual Spend with Discounts is what you paid with RIs and Savings Plans, amortizing any upfront charges.
On-Demand Equivalent (ODE) Spend is what you would have paid if no discounts were applied.

Understanding Effective Savings Rate
Let’s look at a simple example to see how ESR works in concept.
Let’s say you are buying widgets. The first 4 are at list price of $10 and the next 6 are at a discounted price of $7. Your price with discount is 4 widgets @ $10 per widget + 6 widgets @ $7 per widget = $82. Your “total equivalent list price” (what you would have paid without a discount) is 10 widgets @ $10 per widget = $100. That makes your ESR = 1 – Discount Price / List Price = 1 – $82 / $100 = 18%. Pretty simple, right?
What makes RIs and Savings Plans more complicated is that the discount rate can vary based on whether or not a corresponding EC2 instance exists for a given hour (or in some cases, second). In other words, RIs and Savings Plans have a “utilization” rate. Let’s look at some RI examples to illustrate.
Example 1: You purchase a single RI with an hourly price of $0.07 (assume no upfront payment). For a given 30-day month, a matching instance is run for 80% of the month (this is the RI utilization). The instance on-demand price is $0.10 per hour. The max RI discount is 30% ($0.07 vs $0.10) but what is the Effective Savings Rate?
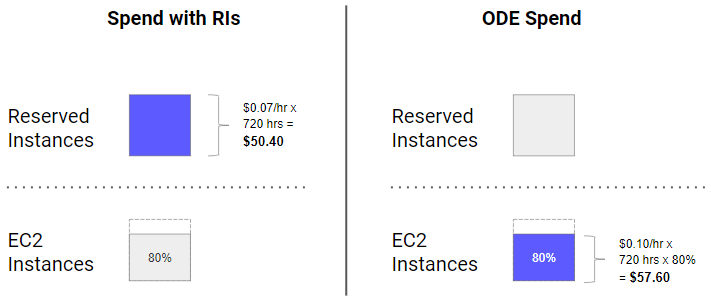
ESR = 1 – Actual Spend with Discounts / ODE Spend = 1 – $50.40 / $57.60 = 12.5%
Example 2: You purchase a single RI with an hourly price of $0.12 (assume no upfront payment). For a given 30-day month, a matching instance is run for 50% of the month (this is the RI utilization). The instance on-demand price is $0.20 per hour. The max RI discount is 40% ($0.12 vs $0.20) but what is the Effective Savings Rate?
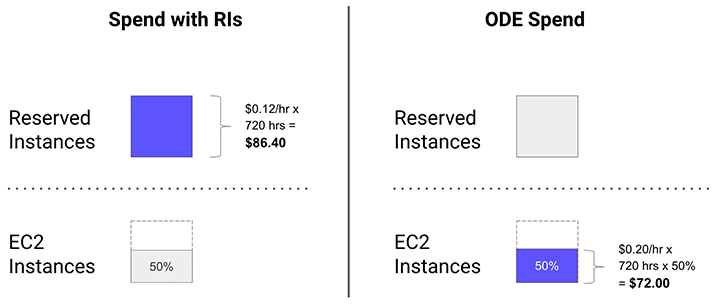
ESR = 1 – Actual Spend with Discounts / ODE Spend = 1 – $86.40 / $72.00 = -20%
Your savings rate was negative which means it was more expensive to run with RIs than fully on-demand. If you aren’t careful, you can lose money with RIs (and Savings Plans)! This happens when a low utilization rate offsets the discount benefit. It’s not uncommon for us to run across customers with a negative ESR, so it’s more prevalent than you might think.
Example 3: Now let’s look at a more complex example. You purchase the following RIs:
- Type A: RI-1 and RI-2 which were each purchased 1 year all upfront for $262.80. To calculate the hourly price, amortize the cost over the term. Hourly price = $262.80 per year / 24 hours per day / 365 days per year = $0.03 per hour.
- Type B: RI-3 which is no upfront with an hourly price of $0.05.
For a given 30-day month, you run the following instances:
- Type A: I-1 for the full month and I-2 for 25% of the month. The on-demand price is $0.06 per hour.
- Type B: I-3 for the full month and I-4 for 50% of the month. The on-demand price is $0.08 per hour.
Given the increased complexity, what is the Effective Savings Rate?
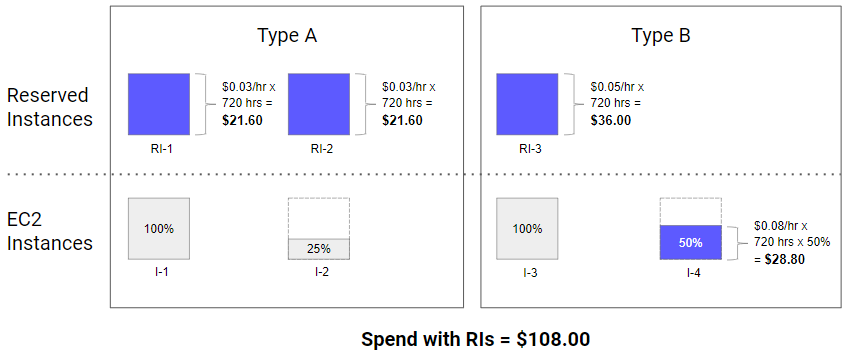
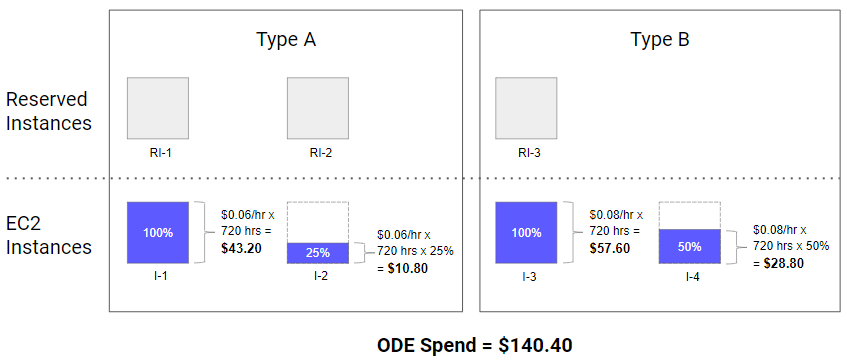
ESR = 1 – Actual Spend with Discounts / ODE Spend = 1 – $108.00 / $140.40 = 23.1%
Note the ESR is lower than either of the individual RI discount rates (RI Type A is a max of 50% and RI Type B a max of 37.5%). When we ask RI users if they know their ESR, they rarely do, but they generally estimate it to be higher than it is.
These are just a few examples to illustrate ESR. The concept is simple, but the real world is often more complex with large savings portfolios of RIs and Savings Plans, dynamic compute fleets (e.g., EC2, Fargate, and Lambda), per second billing, instance size flexibility, etc.
Wrapping Up
Effective Savings Rate (ESR) is the ROI of savings instruments. It is the one savings metric you can use to measure effectiveness, regardless of the savings strategy being employed (ad hoc scripts, AWS Cost Explorer, cloud management platform, etc.).
In the next ESR post, we look at the limitations of input metrics like utilization and coverage and how those metrics can look deceptively healthy while ESR is poor.
If you’d like to learn your ESR, we offer a free, no obligation Compute Savings Analysis that includes ESR and more.


